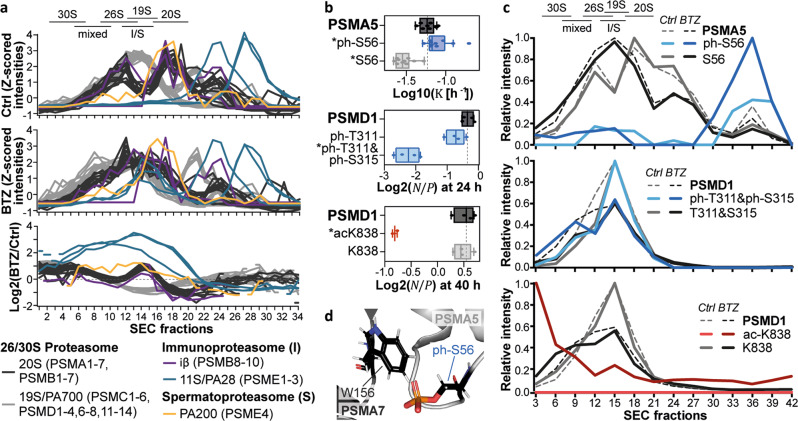
Fig. 3. PTMs in different complex and monomer fractions of the proteasome.
a Size exclusion chromatography (SEC) profiles of proteasomal subunits in RPMI8226 cells upon proteasome inhibition (n = 1 biological replicate, see Supplementary Fig. 7 for an additional HeLa cell replicate). The upper and middle panel show profiles from control (Ctrl) and Bortezomib (BTZ)-treated cells (1 µM, 16 h), respectively. The lower panel displays changes upon proteasome inhibition as log2 ratios. Fractions containing proteasome complexes are indicated based on extrapolation of lower molecular weight markers (mixed: 20 S + 19 S + 11 S or 20 S + 19 S + PA200). b Tukey-boxplots of log10 values or log2 ratios for selected proteasomal subunits and modification sites (box borders: 1st and 3rd quartile; lines in boxes: medians; whiskers: ranging to greatest value within 1.5× interquartile range; dots: replicate measurements; dashed line: median of protein ; *: significantly different turnover to protein or unmodified counterpart). Boxplots are based on n = 4 cell culture replicates, except for PSMD1_ac-K838 (n = 2). For PSMA5 boxplots, the number of peptides and spectra varies for each replicate and can be retrieved from Supplementary Data 1. c SEC profiles for proteins, modified and unmodified sites displayed in panel b with and without proteasome inhibition (n = 1 biological replicate, see Supplementary Fig. 7 for an additional HeLa cell replicate). Peptide profiles were acquired via targeted parallel-reaction monitoring assays using pooled SEC fractions, while protein intensities from whole proteome measurements were combined in silico for every three adjacent fractions. d Clash of phosphorylated PSMA5 S56 with PSMA7 W156 within the α-ring of the proteasome (PDB 5LE527). The PyMol plugin PyTMs was used to add the phospho-group to the serine residue. Source data are provided as a Source Data file.

