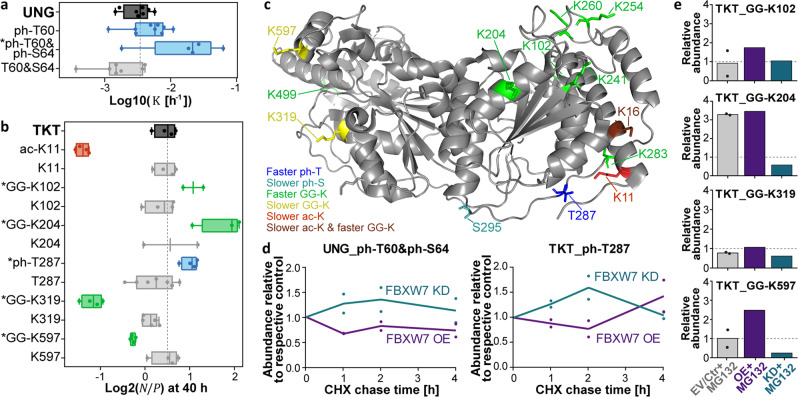
Fig. 6. Identification of a potential F-box degron on transketolase.
a Tukey-boxplots of log10 values for UNG and the site constituting a known FWBX7-phosphodegron (PGT(ph)PPSS(ph); box borders: 1st and 3rd quartile; lines in boxes: medians; whiskers: ranging to greatest value within 1.5× interquartile range; dots: replicates; dashed line: median of protein turnover; *: significantly different turnover to protein or unmodified counterpart). Boxplots are based on n = 4 cell culture replicates, except for ph-T60&S64 (n = 3). The number of peptides and spectra included varies for the protein and each site and replicate and can be retrieved from Supplementary Data 1. b Same as in panel a, but for log2 ratios of TKT and selected PTMs. Boxplots are based on n = 4 cell culture replicates, except for GG-K204 (n = 3), GG-K102 and K204 (both n = 2). The number of peptides varies for sites and replicates and can be retrieved from Supplementary Data 1. The sequence around the phosphorylated threonine 287 (LAT(ph)PPQE) resembles another reported consensus sequence for FBWX7 phosphodegrons ([LIVMP]XTPXXE]). c TKT structure (PDB 3MOS37) annotated with modification sites that are linked to a significant turnover difference. Residues are colored according to their impact on the turnover determined by dSILAC. d Line charts showing the average relative abundance of the phosphodegron-resembling peptides of UNG (left panel) and TKT (right panel) in cycloheximide (CHX) chases after overexpression (OE) or knockdown (KD) of FBWX7. Phosphopeptide profiles were acquired via targeted parallel-reaction monitoring assays. Points represent n = 2 cell culture replicates. e Bar charts illustrating the response of ubiquitination for individual lysine sites of TKT after 2 h CHX treatment and proteasome inhibition using MG132 (EV: empty vector; CTR: control siRNA, n = 1 replicate). Di-Gly peptide profiles were acquired via targeted parallel-reaction monitoring assays and relative intensities were calculated using appropriate controls (EV/CTR for EV/CTR+MG132, OE for OE+MG132, CTR+MG132 for KD+MG132). Points represent respective control samples, EV and CTR (n = 2 biological replicates). Source data are provided as a Source Data file.

