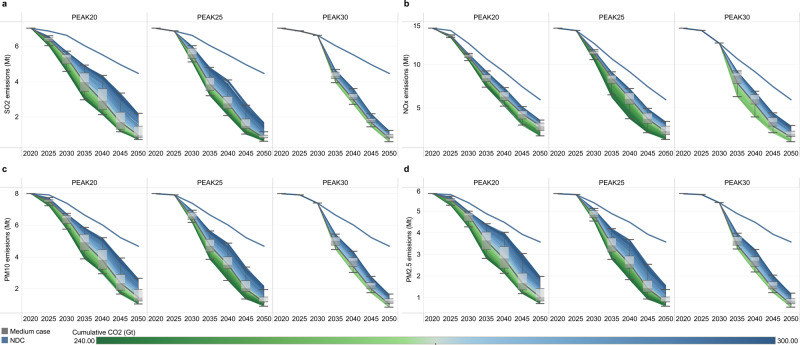
Fig. 10. Synergistic benefit of the CO2 emission reduction on air pollutant control (unit: Mt).
a–d shows sulfur dioxide (SO2), nitrogen oxide (NOX), particulate matter with an aerodynamic diameter no greater than 10 μm (PM10) and particulate matter with an aerodynamic diameter no greater than 2.5 μm (PM2.5) emissions, respectively. The control measures of SO2, NOX, PM10 and PM2.5 are based on the current levels; that is, only considering the synergy of CO2 emission reduction, not considering the effects of subsequent local air pollutant control measures. The box plot shows the first quantile, intermediate range (IQR), and third quantile of all the results, where the data range within 1.5 times the IQR is denoted with whiskers. The thick blue line represents the pathway for the NDC scenario, and the thick gray line represents the pathway for the intermediate case in each scenario. The divergent color from blue to green reflects the increasing stringency of the cumulative carbon budget. The cumulative CO2 parameter corresponds to the absolute value of China’s cumulative carbon budget for 2010–2050.

