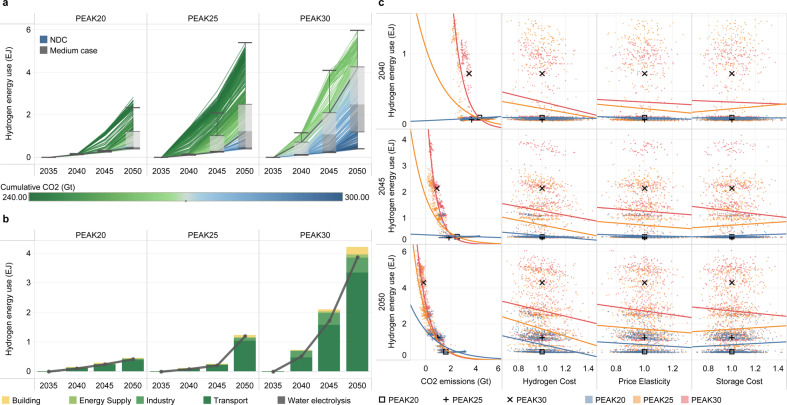
Fig. 7. Uncertainty analysis of hydrogen energy.
a shows the development of hydrogen energy (unit: EJ). The box plot shows the first quantile, intermediate range (IQR), and third quantile of all the results, where the data range within 1.5 times the IQR is denoted with whiskers. The thick blue line represents the pathway of the NDC scenario, and the thick gray line represents the pathway for the intermediate case in each scenario. The divergent color from blue to green reflects the increasing stringency of the cumulative carbon budget. The cumulative CO2 parameter corresponds to the absolute value of China’s cumulative carbon budget for 2010–2050. b presents a decomposition of the different uses of hydrogen energy (stacked bar chart) and the production of hydrogen from water electrolysis (black line) for the intermediate cases. c represents the relationship between the development of the hydrogen energy and uncertain input parameters and CO2 emissions. Three parameters with significant impacts among the fourteen uncertain input parameters are shown for each technology. The remaining results are shown in Supplementary Fig. 12. The variables (except for the CO2 emissions) represent multiples of the intermediate cases for each scenario. The intermediate cases of PEAK20, PEAK25, and PEAK30 are denoted with square, plus, and multiplication signs, respectively.

