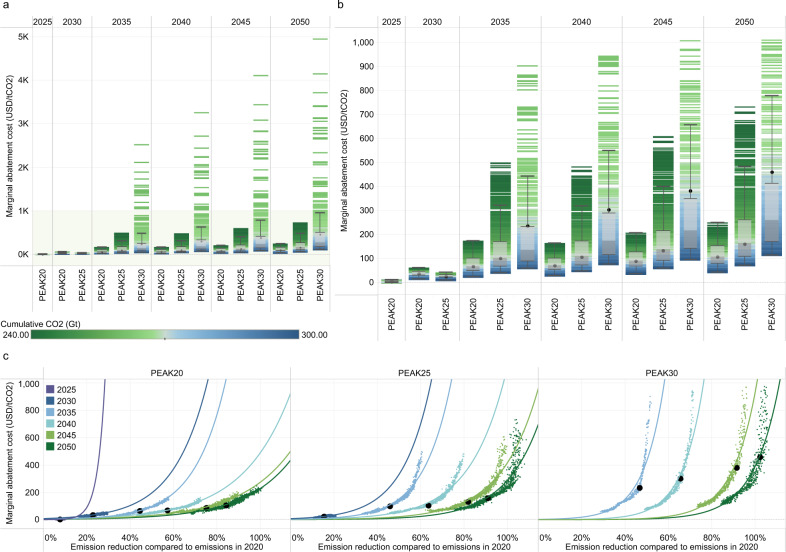
Fig. 9. Marginal abatement cost under different scenarios (unit: US dollars/tCO2).
a represents the marginal abatement cost of all feasible cases. b enlarges the concentrated data in panel a (green shadow) corresponding to all cases with carbon prices below 1,013 US dollars per ton CO2 by 2050 (90% of the total feasible cases for PEAK30). c Relationship between the marginal abatement cost and the CO2 emission reduction in reference to emissions in 2020 (as fitted by an exponential function). The black points represent the marginal abatement costs for the intermediate cases in each scenario. The box plot shows the first quantile, intermediate range (IQR), and third quantile of all the results, where the data range within 1.5 times the IQR is denoted with whiskers. The divergent color from blue to green reflects the increasing stringency of the cumulative carbon budget. The cumulative CO2 parameter corresponds to the absolute value of China’s cumulative carbon budget for 2010–2050. Supplementary Fig. 18 shows the relationships between the marginal abatement cost and other uncertain parameters.

