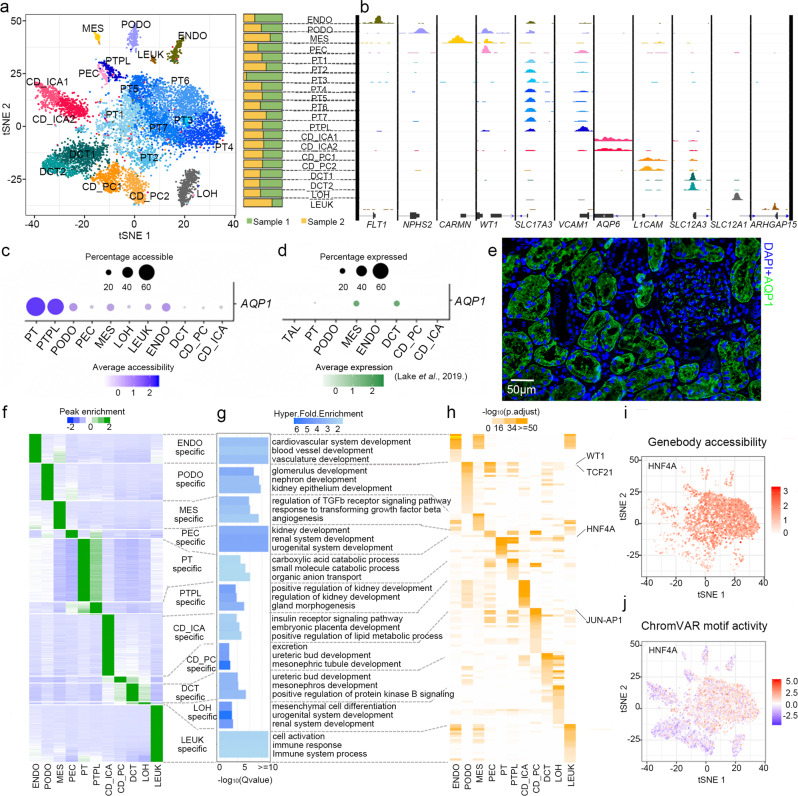
Fig. 1. Single cell chromatin accessibility captures cell type-specific epigenetic features in human kidney.
a t-SNE embedding of 9428 kidney cells colored by clustering (left), and the proportions of each cluster in two samples (right). A total of 20 clusters with more than 50 cells were annotated. b Aggregated chromatin accessibility view shows cell type-specific chromatin accessibility at kidney cell type markers. c Genebody accessibility of AQP1 in scATAC-seq. d RNA level of AQP1 in scRNA-seq (Lake et al.21). e Immunofluorescence staining of paracancerous kidney tissues confirmed PT-specific expression of AQP1 (green) in kidney. Nucleus was stained with DAPI (blue). Data is from one experiment representative of three independent samples examined. f K-means clustering of 19,409 cell type-specific peaks with each cell type showing specific accessible regions. Each row represents a cell type-specific peak, and each column represents an individual cell type. g Enriched GO terms for cell type-specific peaks. Top three biological processes in each cell type are shown. h Heatmap of motif enrichment on cell type-specific peaks for each cell type. Each row represents a transcription factor motif and each column represents an individual cell type. Only motifs with -log10(p.adjust) > 10 in at least one cell type are shown. t-SNE of genebody accessibility (i) and chromVAR motif activity (j) of HNF4A in scATAC-seq show PT-specific expression and function of HNF4A. Source data are provided as a Source Data file.

