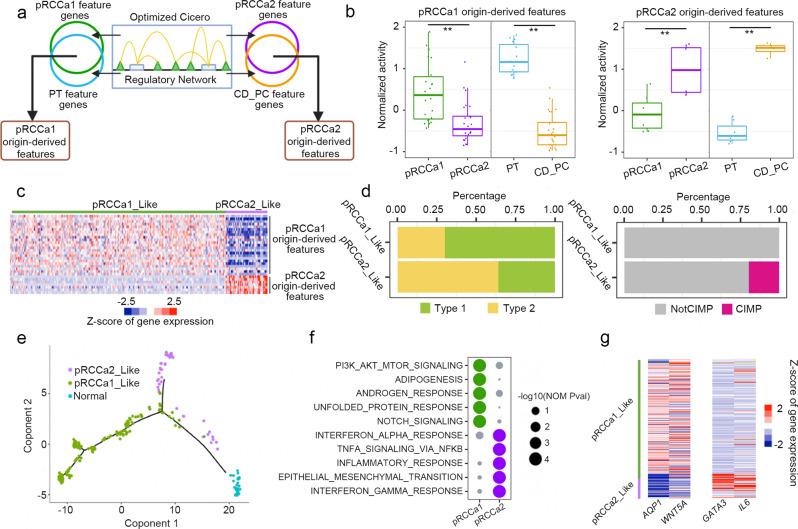
Fig. 3. pRCC with different cell-of-origin show different characteristics.
a Strategy used to obtain origin-derived feature genes from chromatin accessibility. Optimized Cicero was used to construct a regulatory network from chromatin accessibility profiles. Regulatory networks are used to extract feature genes. Overlapping feature genes in pRCC subgroups and their respective cell-of-origin produce the origin-derived features. b Normalized gene activities of origin-derived features in pRCCa1, pRCCa2, PT and CD_PC. Gene activities were calculated based on the regulatory networks. Box plots show distribution of gene activities of origin-derived features. Each dot represents an individual feature gene. Feature genes show the pRCC subgroup and kidney cell type-specific activities. Box plots depict the median, quartiles and range. n = 25 genes for pRCCa1 origin-derived features and n = 7 genes for pRCCa2 origin-derived features. p = 3.97e-09 between pRCCa1 and pRCCa2 and p = 6.24e-16 between PT and CD_PC on differential activity of pRCCa1 origin-derived features. p = 0.009 between pRCCa1 and pRCCa2 and p = 0.0007 between PT and CD_PC on differential activity of pRCCa2 origin-derived features. Two-sided paired t tests were used. ** indicates p < 0.01. c Heatmap of gene expression of origin-derived features for 255 TCGA pRCC samples show two expression patterns, pRCCa1_Like and pRCCa2_Like. Colors represent Z-scores of RNA-seq gene expression across the samples. Each row represents a feature gene and each column represents a pRCC sample. d Percentage of pathological Type 1/Type 2 (left) or CIMP (right) in pRCCa1_Like or pRCCa2_Like samples. e Trajectory of the 255 TGCA pRCC samples and 32 normal kidney samples show pRCC diverged into distinct branches. Samples are colored according to their identities. f Top 5 Gene Set Enrichment Analysis (GSEA) hallmark terms enriched in pRCCa1 or pRCCa2 compared with their respective cell-of-origin based on gene activity. g Expression of representative genes in 255 TCGA pRCC samples in the same order as c. AQP1: feature gene for pRCCa1 with PT origins; WNT5A: representative gene in Notch pathway; GATA3: feature gene for pRCCa2 with CD_PC origins; IL6: representative gene in Interferon-gamma pathway. Colors represent Z-scores of RNA-seq gene expression across the samples. Source data are provided as a Source Data file.

