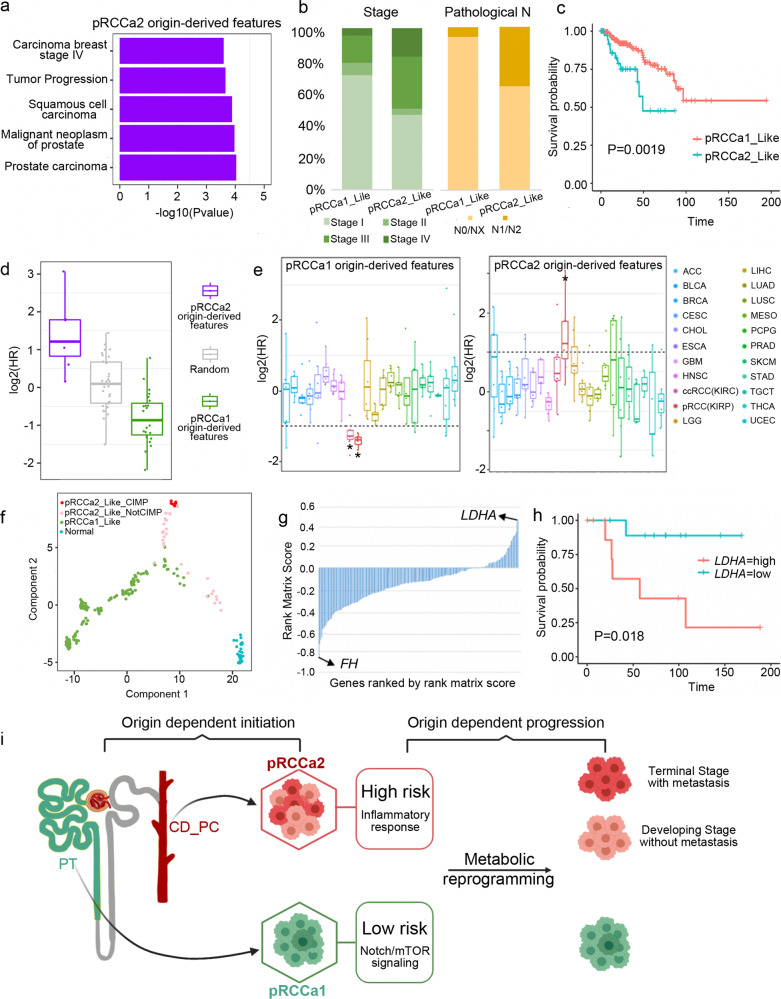
Fig. 4. Cell-of-origin predicts clinical behavior of pRCC.
a Top 5 enriched DisGeNET terms for pRCCa2 origin-derived features suggest that pRCC with these features have poor clinical performance. b Distribution of tumor stage (green), and percentage of metastasis to regional lymph nodes (orange) in pRCCa1_Like or pRCCa2_Like samples. N: regional lymph nodes. N0: No regional lymph node metastasis; NX: Regional lymph nodes cannot be assessed; N1/N2: Metastasis in regional lymph node(s). c Overall survival for pRCCa2_Like samples (n = 41) is poorer than pRCCa1_Like (n = 214). The Log-rank test was used to assess the univariate survival differences. d Hazard ratio from survival analysis for pRCCa2 and pRCCa1 origin-derived features and random selected genes. Boxplot shows distributions of hazard ratios for each group of feature genes. pRCCa2 origin features predicted unfavorable prognosis while pRCCa1 origin features predicted favorable prognosis. Each dot represents an individual gene. Box plots depict the median, quartiles and range. n = 25 genes for pRCCa1 origin-derived features, n = 7 genes for pRCCa2 origin-derived features and n = 30 genes for random selected features. e Hazard ratio from survival analysis for pRCCa1 (left) or pRCCa2 (right) origin feature panel. Survival analysis is performed for individual cancer types. Dash lines indicate log2(HR) = −1 or log2(HR) = 1. Box plots depict the median, quartiles and range. n = 25 genes for pRCCa1 origin-derived features and n = 7 genes for pRCCa2 origin-derived features. * denotes the cancer type with median log2(HR) > 1 or <−1. f Same trajectory as Fig. 3e but with pRCCa2_Like_CIMP and pRCCa2_Like_NotCIMP identified. g Gene expression in the oxidative phosphorylation pathway show LDHA was upregulated while FH was down-regulated. Data is ranked by GSEA rank matrix score (pRCCa2_Like_CIMP versus pRCCa2_Like_NotCIMP). h Kaplan-Meier analysis of overall survival of pRCCa2_Like stratified by LDHA expression. LDHA gene expression was divided into “high” and “low” representing the upper and lower quarter of LDHA gene expression, respectively. The Log-rank test was used to assess the univariate survival differences. i Schematic shows pRCC initiated from different cell-of-origin possesses different molecular characteristics and presents different clinical performance. pRCCa2 with CD_PC origins display a higher risk of progression to terminal stage than pRCCa1 with PT origins. Metabolic reprogramming leads to the progression in pRCCa2. Source data are provided as a Source Data file.

