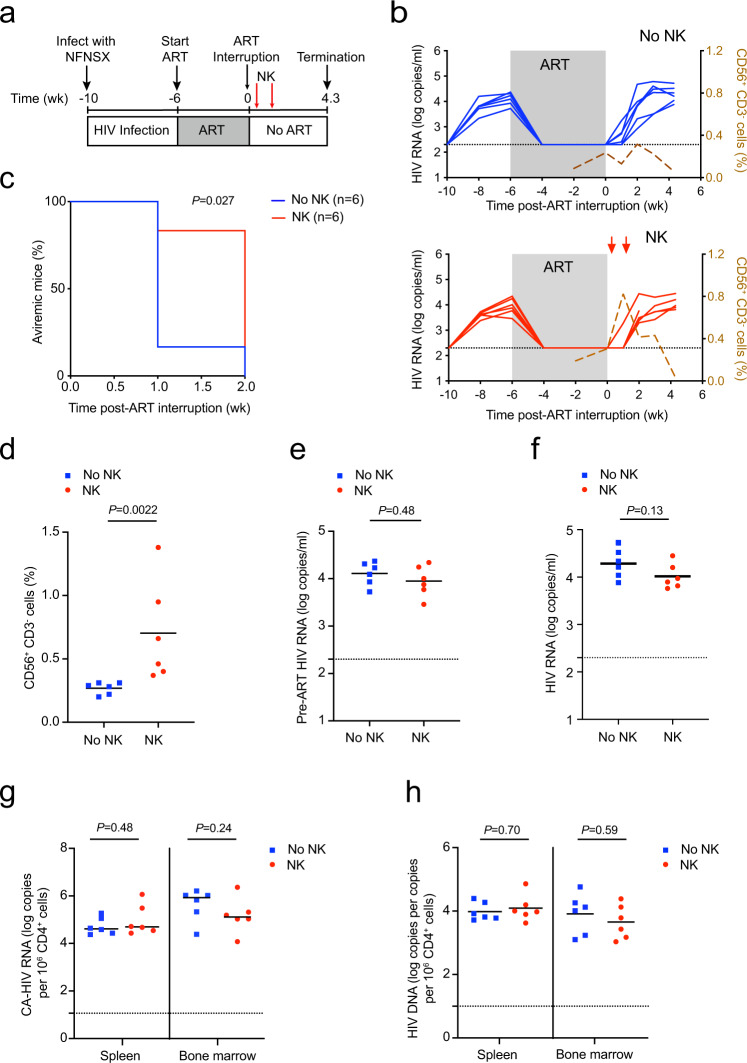
Fig. 1. NK cells delay time to viral rebound after ART interruption in BLT mice infected with HIV strain NFNSX.
a Schematic representation of experiment; acute infection of TKO-BLT mice with NFNSX for 4 weeks, ART for 6 weeks. One day after ART interruption, 5 × 10⁶ allogeneic human peripheral blood NK cells were transferred followed by another homologous dose of NK cells 5 days later. The red arrows denote when NK cells were given. b Longitudinal plasma viral loads for each infected animal at various timepoints in the No NK (blue) and NK (red) groups. Gray shading indicates an ART treatment period of 6 weeks. A dashed brown line indicates the median frequency of CD56+CD3− cells detected in the blood. c Kaplan–Meier curves showing the frequency of aviremic mice after ART interruption. P value calculated by log-rank Mantel–Cox test. d Frequency of CD56+CD3− cells in the blood 5 days after the first injection of NK cells. e, f Plasma viral loads for each animal before ART was initiated (e) and at necropsy (f). g, h Cell-associated “CA” HIV RNA (g) and HIV DNA (h) levels from the spleen and bone marrow of each infected animal. n = 6 biologically independent animals in each group observed over one independent experiment (b–h). The Black dotted line indicates the detection limit of 2.3 log RNA copies per ml (b, e, f) and 1.0 log RNA or DNA copies (g, h). Horizontal bars represent the means (d–h). P values were calculated using a two-tailed Mann–Whitney test (d–h). Source data are provided as a Source Data file.

