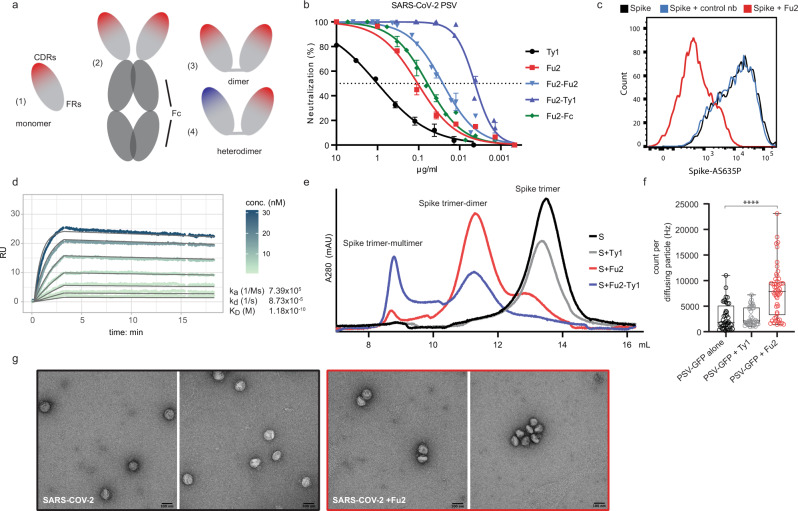
Fig. 1. An RBD-specific nanobody neutralizes SARS-CoV-2.
a Overview of different nanobody constructs used in this study: (1) nanobody monomer, (2) nanobody-Fc fusion, (3) chemically linked nanobody homodimer, (4) chemically linked nanobody heterodimer. b A SARS-CoV-2 spike pseudotyped lentivirus (PSV) was incubated with a dilution series of the indicated nanobodies at 37 °C for 1 hour before infecting HEK293T-hACE2 cells. Neutralization (in %) compared to untreated PSV is shown. Data from two (Fu2) or three (all others) replicates is shown. Data are presented as mean values and standard deviation. Fu2-Fu2 and Fu2-Ty1 refer to the homodimeric and heterodimeric constructs respectively, if just Fu2 or Ty1 is indicated, the monomeric nanobody was used. b with the x-axis in nM is shown in Fig. S1. c Recombinantly expressed, prefusion stabilized, and fluorescently labelled SARS-CoV-2 spike protein was incubated with a control nanobody specific for IAV NP, or Fu2 and used to stain ACE2 expressing HEK293T cells. Cells were analyzed by flow cytometry and a representative histogram is shown. d Binding kinetics of Fu2 to the RBD were measured by surface plasmon resonance (SPR). Sensorgram is color-coded based on concentration. The fit is based on the 1:1 Langmuir model and is shown in dark grey solid lines. e Recombinantly expressed, prefusion-stabilized SARS-CoV-2 spike protein was run alone or preincubated with the indicated nanobody constructs on a Superose 6 size-exclusion column. Elution profiles (A280) are shown. f GFP-labelled SARS-CoV-2 spike pseudotyped lentivirus (PSV-GFP) was incubated with Ty1, Fu2 or left alone and brightness of diffusing virus particles was quantified using fluorescence correlation spectroscopy in solution. Box-and-whisker plots show all data points (as circles) with median as the box center, lower and upper quartiles as the box boundaries and minimum (lower extreme) to maximum (upper extreme) points as error bars. Statistical significance was evaluated using two-sided Kolmogorov–Smirnov test. g SARS-CoV-2 was incubated with or without Fu2 and visualized by negative-stain electron microscopy. This experiment was performed once, and multiple images were taken from each condition. Source data are provided as a Source Data file for b, d and e and f.

