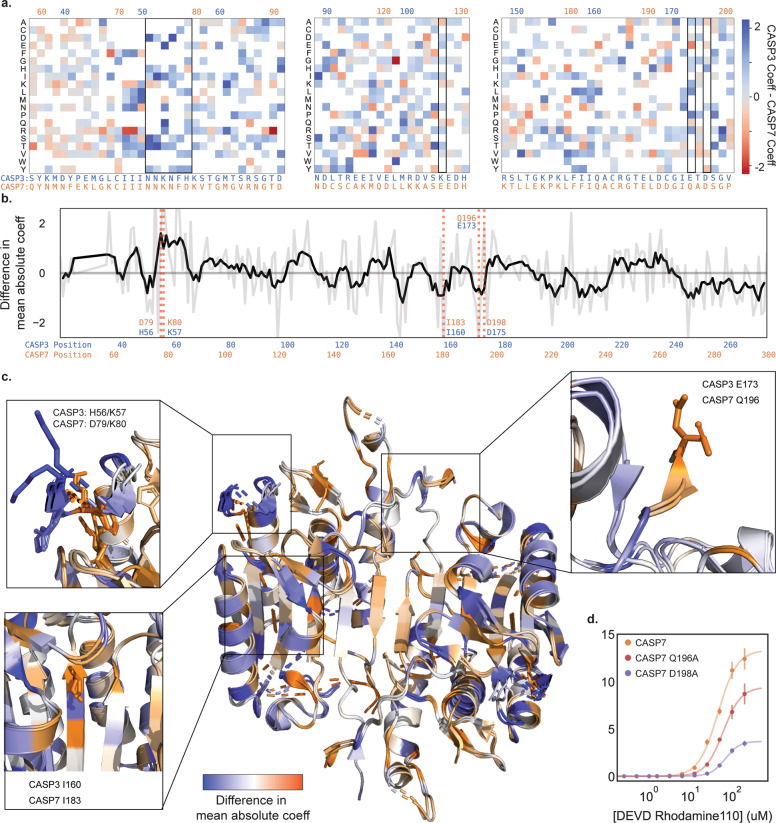
Fig. 3. Divergence in the mutational landscapes of Caspase-3 and -7.
a A heatmap of mutation coefficient differences between CASP3 and CASP7. Blue indicates a larger coefficient in CASP3 and orange indicates CASP7 has a larger coefficient. b Differences in mutational tolerance between CASP3 and CASP7. The light gray line shows the difference in a the mean absolute coefficient of a site between CASP3 and CASP7, and black line is a moving average to highlight general differences. Positive values are positions where CASP3 has a larger mean absolute coefficient and thus mutations at that site have a larger effect. Negative values are where CASP7 has a larger effect. The red dotted lines indicate positions of interest. c A mapping of the difference in mean absolute coefficient onto the aligned CASP3 and CASP7 structures (2H5J and 2QL5, respectively). The expanded boxes highlight the sequence regions shown in (a and b). d Kinetic analysis of CASP7 Q196A and CASP7 D198A.

