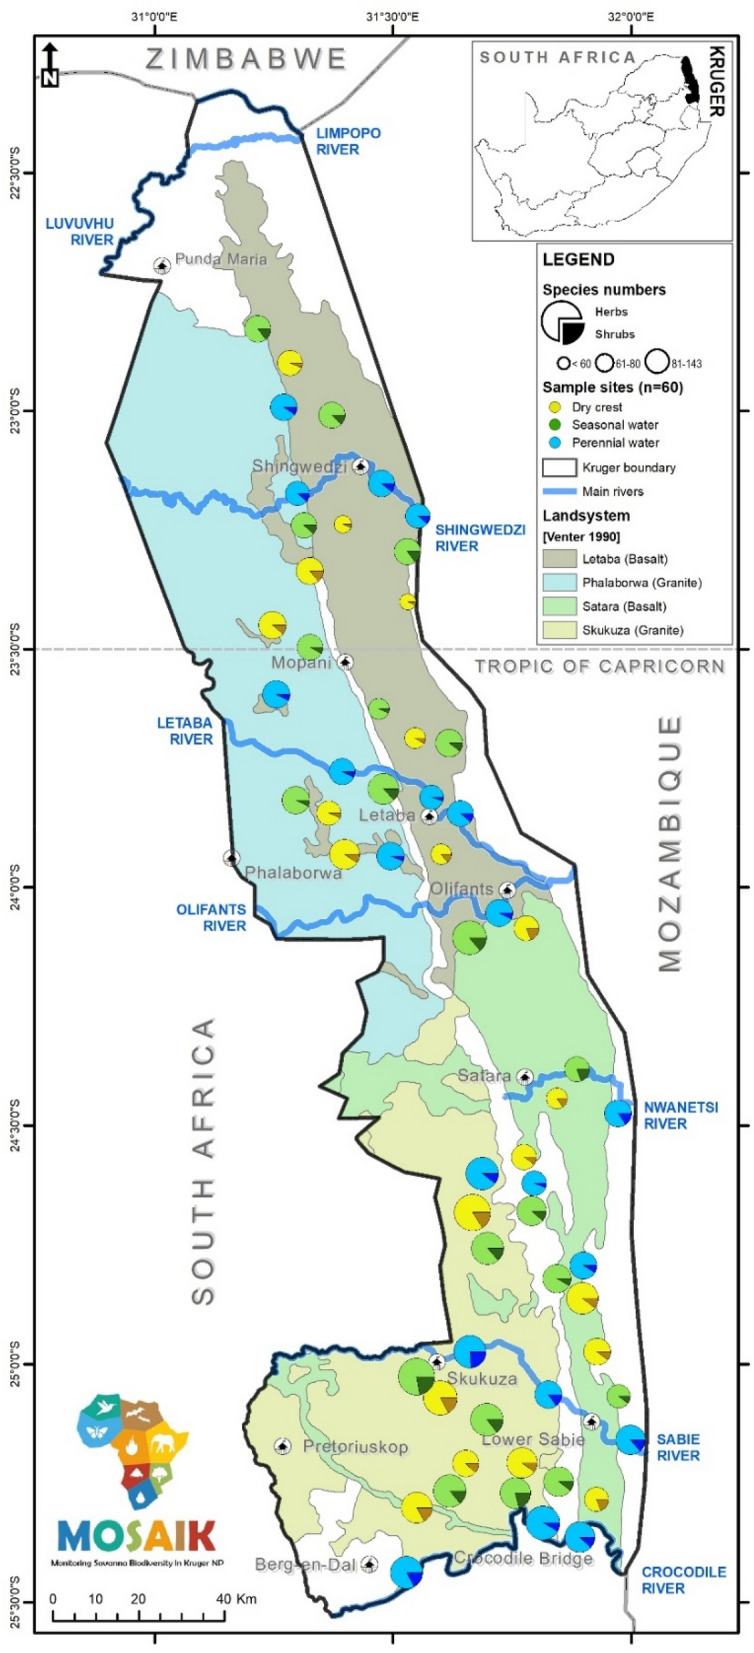
Figure 2.

Kruger National Park map with the location of study plots across habitats (dry crest, seasonal river, perennial river) and bedrocks (basalt and granite), reflecting the four most represented landsystems. The total plant species richness in a plot (per 2500 m2) and the proportion accounted for by herbs (including grasses) and shrubs is indicated by the size of the circle and shade of the colour, respectively. The figure was created using ArcGIS Desktop, Release 10.4 (Redlands 2011, https://www.esri.com).
