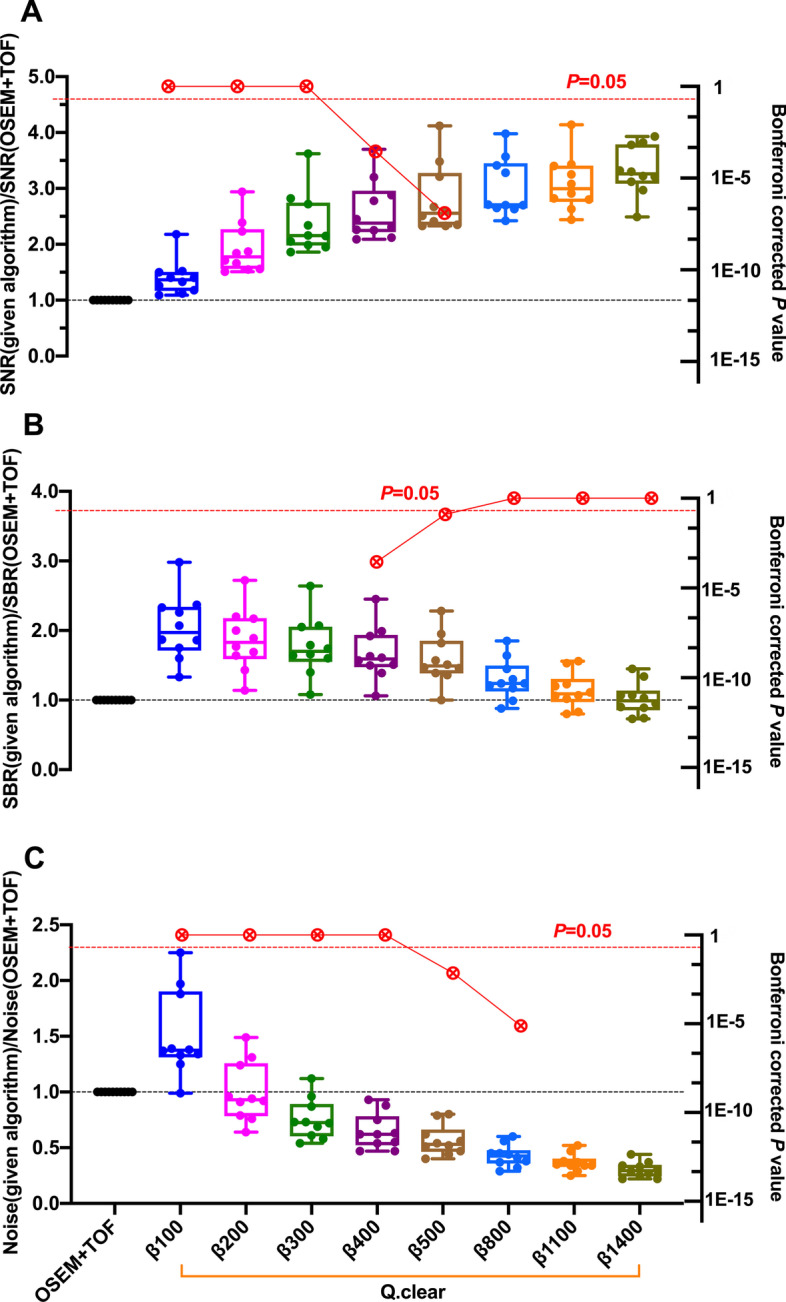
Fig. 3.

Box plots of SNR (A), SBR (B) and noise level (C) values calculated among the PET images of torso oncologic patients with different reconstruction algorithms. These were shown for Q.Clear (β = 100, 200, 300, 400, 500, 800, 1100 and 1400), normalized to OSEM + TOF (3 iterations, 28 subsets, 4.0-mm filter) (left Y-axis). The lines, upper and lower halves of the box represent the median, upper and lower quartiles, respectively. Bonferroni corrected P values between OSEM + TOF and a given algorithm (Q.Clear with specific β value) were also presented in red circles (right Y-axis).
