Fig. 1.
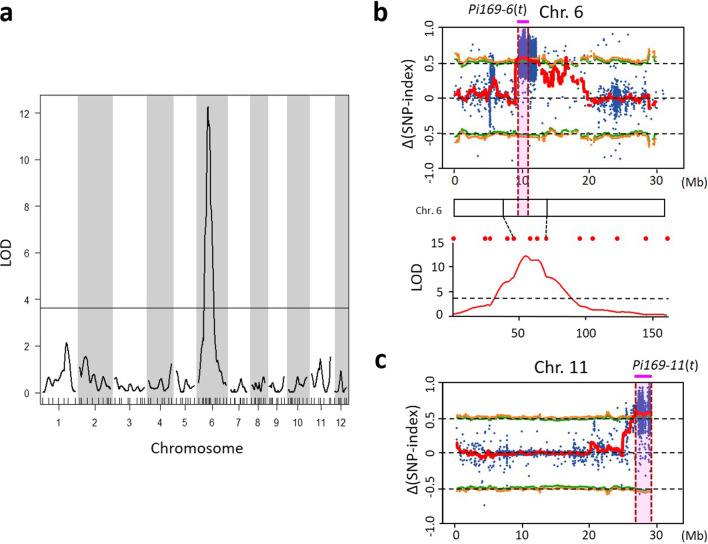
Mapping of the blast resistance genes in SA0169 using linkage analysis and QTL-seq. a Log of odds (LOD) plot by the Haley-Knott regression method. Solid line indicates the LOD threshold of 3.64. b Δ(SNP‐index) plot of chromosome 6 with statistical confidence intervals under the null hypothesis of no QTLs (green lines, P < 0.05; orange lines, P < 0.01). Blue dots, ∆ SNP‐index. Red lines, the average Δ(SNP‐index) in a 1 Mb region using a 10 kb sliding window. Pink shaded region indicates the candidate region of blast resistance using the QTL-seq strategy (Pi169-6(t)). Bottom, LOD plot of blast resistance by linkage mapping. c Δ(SNP‐index) plot of chromosome 11. Pink shaded region indicates the candidate region of blast resistance (Pi169-11(t))

