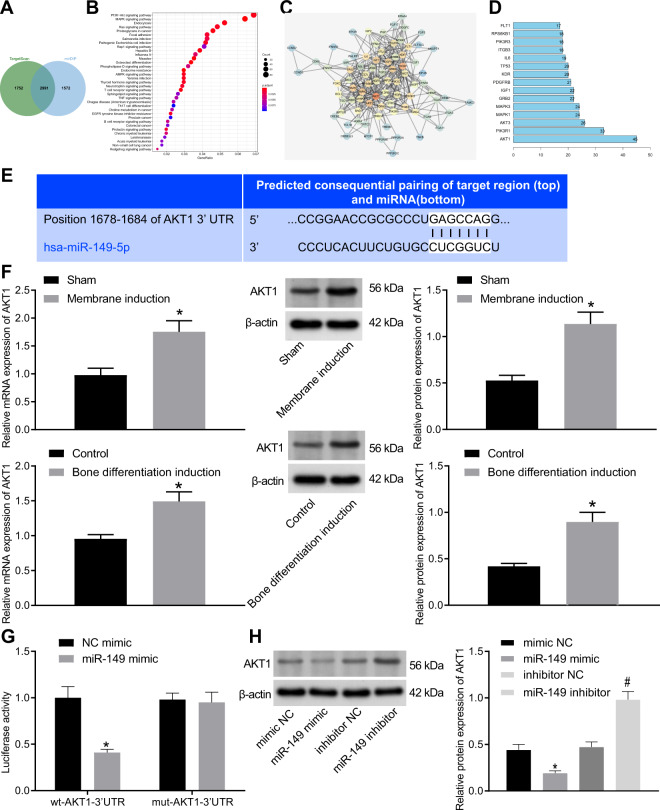
Fig. 3. miR-149 targeted AKT1 and repressed the expression of AKT1.
A The predicted downstream genes of miR-149, the two circles in the figure represented the prediction results of the TargetScan database and the prediction result of the mirDIP database, and the middle part represented the intersection of the two sets of data. B The KEGG pathway enrichment analysis of predicted downstream of miR-149, the abscissa in the figure represented the GeneRatio, the ordinate represents the KEGG entry, the size of the circle represents the number of genes enriched in this entry, and the color represented the enrichment p value. C The interaction analysis of candidate genes that were enriched in the PI3K-AKT signaling pathway, each circle in the figure represented a gene, and the lines between the circles indicated that genes had an interaction relationship. The more interacting genes a gene had, the greater the degree value, the higher the core degree of a gene in the network diagram, the darker the color of the circle. D The degree value statistics of the top 15 genes with the highest core degree, the abscissa represented the degree value, and the ordinate represents the gene name. E The prediction of the binding between AKT1 and miR-149. F The expression of AKT1 in the periosteal tissues of rat receiving the Masquelet-induced membrane technique and cells after osteogenic differentiation, *p < 0.05 compared with sham-operated rats or control cells. G The binding of miR-149 to AKT1 detected by dual luciferase reporter gene assay, *p < 0.05 compared with cells transfected with NC-mimic. H The protein expression of AKT1 after different treatment determined by western blot analysis, *p < 0.05 compared with cells transfected with mimic-NC, #p < 0.05 compared with cells transfected with inhibitor-NC. Data were expressed as expressed as mean ± standard deviation. Unpaired t test was used for data comparison between two groups, and one-way ANOVA was used for data comparison among multiple groups, followed by Tukey’s post hoc test. The experiment was repeated three times. ALP alkaline phosphatase, OCN osteocalcin, ANOVA one-way analysis of variance.

