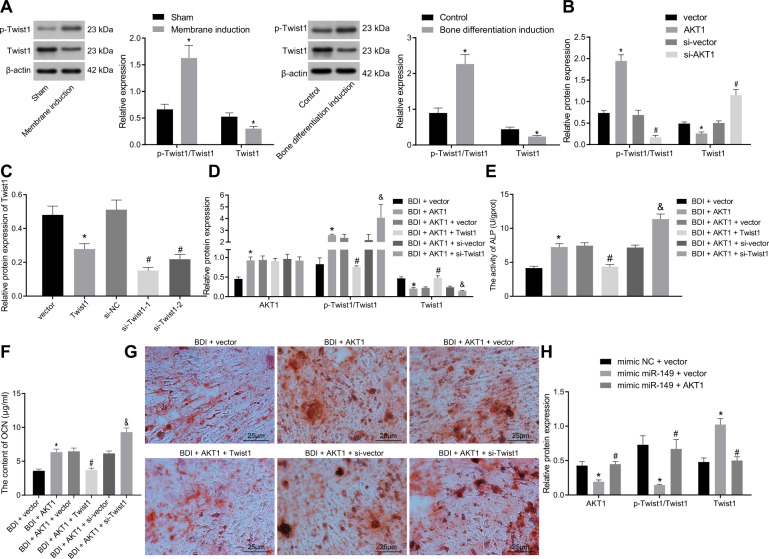
Fig. 5. AKT1 facilitated osteogenic differentiation of MSCs by promoting Twist1 degradation.
A The phosphorylation level of Twist1 and Twist1 protein level determined by western blot analysis, *p < 0.05 compared with sham-operated rats or control cells. B The phosphorylation level of Twist1 and Twist1 protein level determined by western blot analysis, *p < 0.05 compared with cells transfected with vector, #p < 0.05 compared with cells transfected with si-vector. C The expression of Twist1 measured by western blot analysis. D The expression of AKT1 and Twist1 determined by western blot analysis. E ALP activity in cells. F OCN content in cells. G Calcium deposition determined by calcified nodule staining (scale bar = 25 μm). *p < 0.05 compared with cells transfected with vector, #p < 0.05 compared with cells transfected with AKT1 + vector, &p < 0.05 compared with cells transfected with AKT1 + si-vector, n = 3. H The expression of AKT1 and Twist1 determined by western blot analysis. *p < 0.05 compared with cells transfected with mimic-NC + vector, #p < 0.05 compared with cells transfected with mimic-miR-149 + vector. Data were expressed as mean ± standard deviation. Unpaired t test was used for data comparison between two groups and one-way ANOVA was used for data comparison among multiple groups, followed by Tukey’s post hoc test. MSC mesenchymal stem cell, ALP alkaline phosphatase, OCN osteocalcin, ANOVA one-way analysis of variance.

