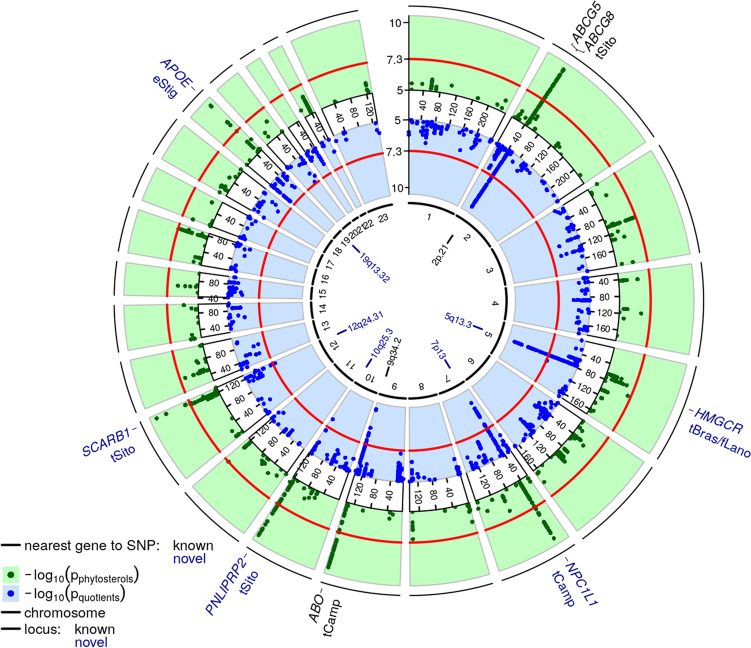
Fig. 1. Circus plot of genetic associations of phytosterol traits.
We present results of our genome-wide association analyses as circus plot. Dots in green and blue rings correspond to association statistics (−log10(p-values) of fixed effect meta-analysis of gene-dose effects) of raw phytosterols, respectively normalized phytosterols and quotients. Only values larger than five are displayed. Values larger than ten are set to ten. Slices correspond to chromosomes. Physical positions are shown in Mb. The red circles mark the level of genome-wide significance (−log10(5 × 10⁻⁸)). In the centre of the plot, new loci are shown in blue colour, while known loci are depicted in black. Most plausible candidate genes per locus and respective best associated traits are provided at the outer ring. Abbreviations of traits are given in Supplementary Data S18.

