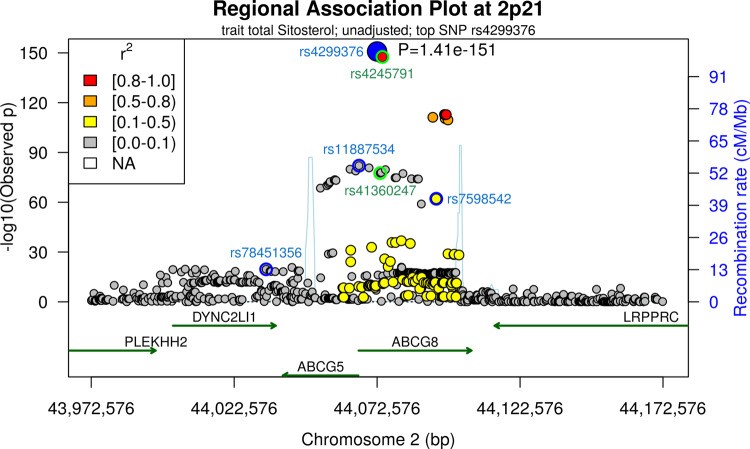
Fig. 2. Fine-mapping of 2p21 locus.
We present a regional association plot of the 2p21 region. A window of 100 kb around the top-SNP is presented. Dots correspond to SNP position and −log10(p-values) of fixed effect meta-analysis of gene-dose effects for total sitosterol. The large blue dot depicts the top-SNP of that locus. Colours of small dots indicate LD (r2) with the top-SNP. We also provide annotated genes within the locus and recombination rates to mark haplo-blocks. We present unconditioned association results. According to Cojo-select analysis, four independent variants are detected (blue circles plus the main hit). Of note, three of the variants are confined within one haplo-block and could be attributed to ABCG8 while the fourth variant (rs78451356) lies in a neighbouring haplo-block corresponding to ABCG5/DYNC2LI1. Green circles mark variants reported in our former GWAS. Regional association plots of the respective conditional association results are provided as Supplementary Fig. S2.

