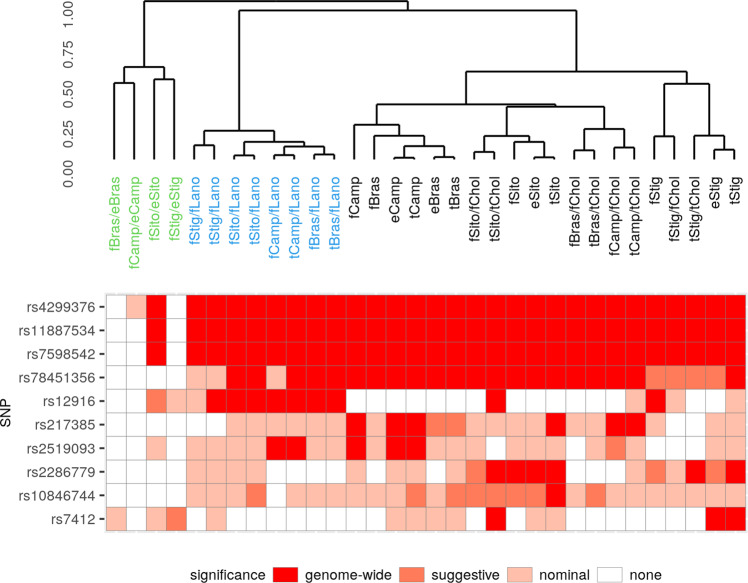
Fig. 3. Association results per top-SNP.
Overview of the ten independent SNPs found in our genome-wide association analysis and their respective trait associations. Colour coding corresponds to level of significance of the respective traits. The distance function used for the dendrogram corresponds to the partial correlations of the analysed phytosterol traits (see ‘Methods’ for details). Ratios of phytosterols to lanosterol (blue) and free to esterified ratios (green) cluster separately. The pattern of significances mirror this correlation structure. The hit at 5q13.3 (rs12916, fifth row) is driven by a strong lanosterol association. A locus-wise presentation of associations can be found in Supplementary Data S7.

