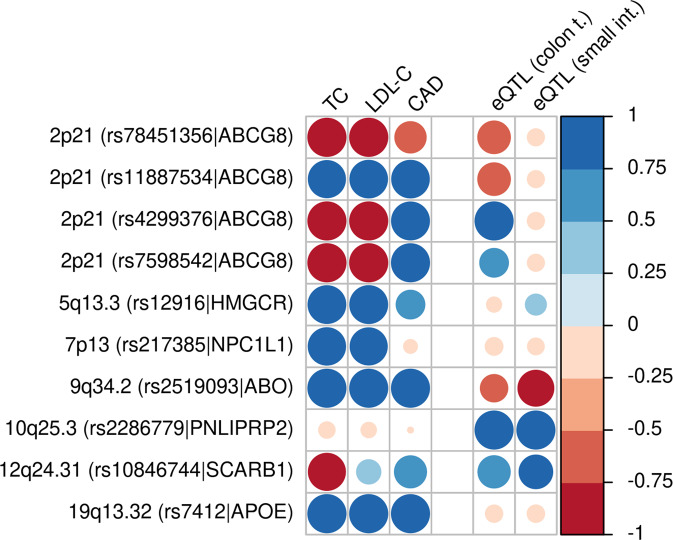
Fig. 4. Results of colocalization analysis.
The ten independent meta-GWAS signals were subjected to colocalization analysis with other traits and eQTLs in colon tissue and small intestine. We depict the posterior probabilities of H4 (evidence of colocalization) in blue and the negative posterior probabilities of H3 (no evidence of colocalization) in red. Darkness of colour and size of circles correspond to the numerical value of the corresponding posterior probability. EQTLs are restricted to interesting findings. Analysis of eQTLs in other tissues are shown in Supplementary Fig. S6. Numerical results are shown in Supplementary Data S9. TC = Total cholesterol, LDL-C = low-dense lipoprotein-cholesterol, CAD = coronary artery disease, eQTL = expression quantitative trait locus.

