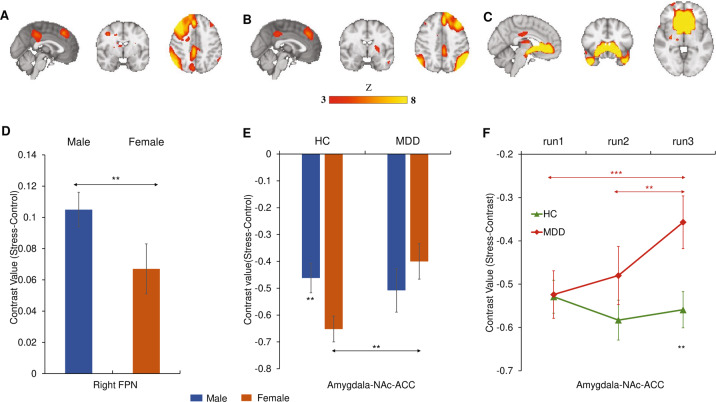
Fig. 4. Neural network responses to acute psychosocial stress.
Group spatial maps of the (A) right frontoparietal network, (B) the left frontoparietal network, and (C) amygdala-NAc-ACC network. D Sex differences in the right frontoparietal network. E Sex × Diagnosis interaction effect in the amygdala-NAc-ACC network. F Diagnosis × Time interaction effect in the amygdala-NAc-ACC network. Estimated-mean are plotted, and error bars represent SE. HC healthy controls, MDD major depressive disorder, FPN frontoparietal network, NAc nucleus accumbens, ACC anterior cingulate cortex. *p Bonferroni < 0.05, **p Bonferroni < 0.01, ***p Bonferroni < 0.001.

