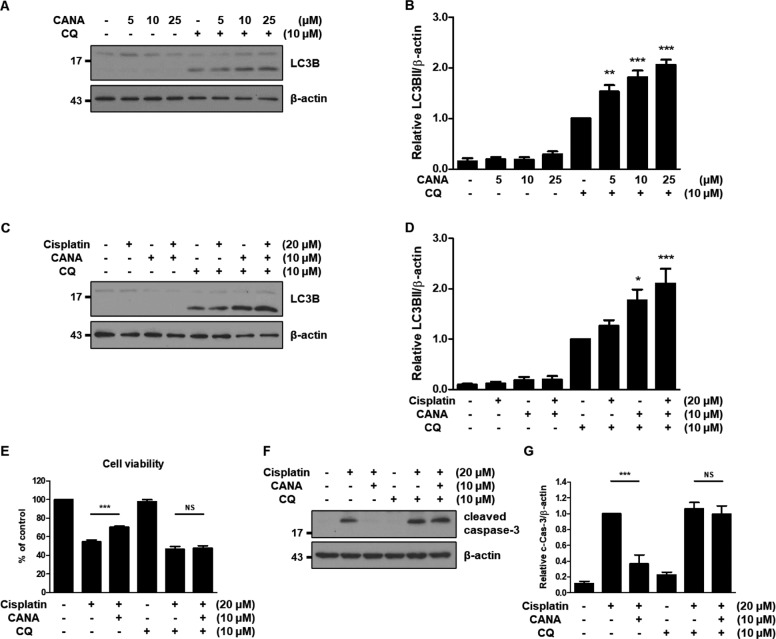
Fig. 2. Canagliflozin induces autophagy in HK-2 cells and protects HK-2 cells from cisplatin in an autophagy-dependent manner.
HK-2 cells were treated with the indicated concentrations of canagliflozin (CANA) in the absence or presence of 10 μM chloroquine (CQ) for 24 h (A–B). A Representative immunoblot analysis. B Densitometric analysis of immunoblots to estimate the relative abundance of LC3BII normalized to that of β-actin. Data are expressed as mean ± SD (N = 5). Differences between groups were evaluated using one-way ANOVA followed by Bonferroni’s multiple comparison test. **P < 0.01, ***P < 0.001, significantly different from the chloroquine-only treated group. HK-2 cells were treated with indicated concentrations of cisplatin, canagliflozin, and/or chloroquine for 24 h (C–G). C Representative immunoblot analysis. D Densitometric analysis of immunoblots to estimate the relative abundance of LC3BII normalized to that of β-actin. Data are expressed as mean ± SD (N = 5). Differences between groups were evaluated using one-way ANOVA followed by Bonferroni’s multiple comparison test. *P < 0.05, ***P < 0.001, significantly different from the chloroquine-only treated group. E Cell viability was evaluated via CCK-8 assay. Data are expressed as mean ± SD (N = 6). Differences between groups were evaluated using one-way ANOVA followed by Bonferroni’s multiple comparison test. ***P < 0.001. NS, not significant. F Representative immunoblot analysis. G Densitometric analysis of immunoblots to estimate the relative abundance of cleaved caspase-3 as normalized that of β-actin. Data are expressed as mean ± SD (N = 4). Differences between groups were evaluated using one-way ANOVA followed by Bonferroni’s multiple comparison test. ***P < 0.001. NS, not significant.

