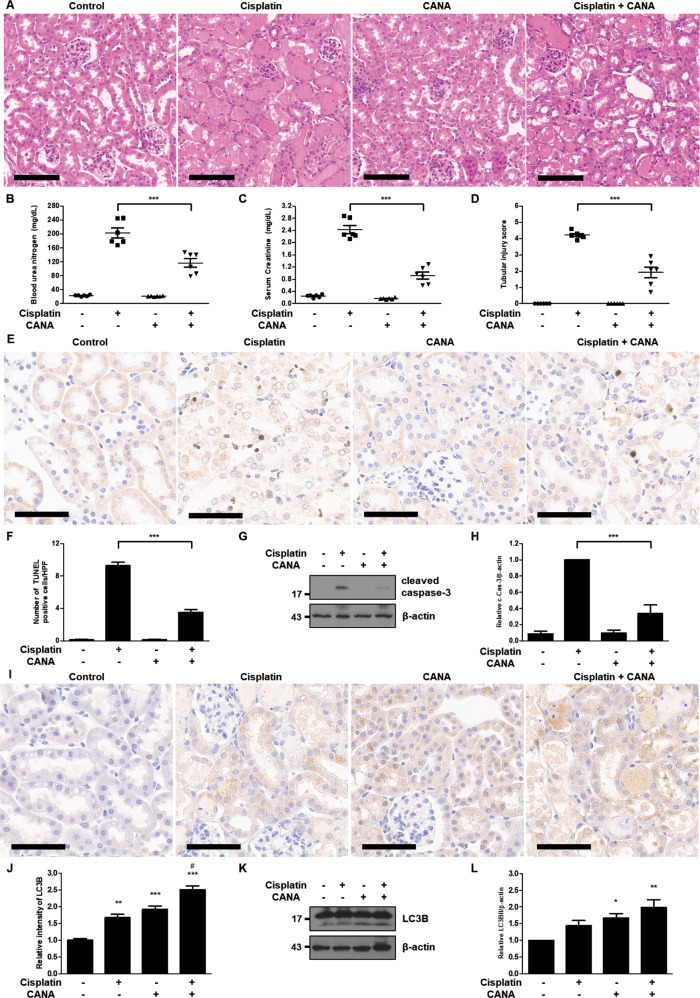
Fig. 4. Canagliflozin attenuates cisplatin-induced AKI and increases autophagy in mice.
C57BL/6 mice were administered with canagliflozin (CANA) (10 mg/kg) or vehicle orally for five consecutive days, and intraperitoneal injection of cisplatin (20 mg/kg) or saline was done on the 5th day of the treatment. Mice were euthanized at 72 h after cisplatin injection to collect blood samples for measurements of blood urea nitrogen and serum creatinine and kidney tissues for histology. A Representative images of kidney H–E staining (scale bar = 100 μm). B Blood urea nitrogen. C Serum creatinine. D Tubular injury score. Data are expressed as mean ± SD (N = 6). Differences between groups were evaluated using one-way ANOVA followed by Bonferroni’s multiple comparison test. ***P < 0.001. E Representative images of TUNEL staining (scale bar = 60 μm). F Quantification of TUNEL-positive cells in kidney tissues. Data are expressed as mean ± SD (N = 6). Differences between groups were evaluated using one-way ANOVA followed by Bonferroni’s multiple comparison test. ***P < 0.001. G Representative immunoblot analysis. H Densitometric analysis of immunoblots to estimate the relative abundance of cleaved caspase-3 as normalized that of β-actin. Data are expressed as mean ± SD (N = 6). Differences between groups were evaluated using one-way ANOVA followed by Bonferroni’s multiple comparison test. ***P < 0.001. I Representative images of IHC staining of LC3B (scale bar = 60 μm). J Quantitative analysis of IHC staining. Data are expressed as mean ± SD (N = 6). Differences between groups were evaluated using one-way ANOVA followed by Bonferroni’s multiple comparison test. **P < 0.01, ***P < 0.001, significantly different from the control. #P < 0.001, significantly different from the cisplatin-only treated group. K Representative immunoblot analysis. L Densitometric analysis of immunoblots to estimate the relative abundance of LC3BII as normalized that of β-actin. Data are expressed as mean ± SD (N = 6). Differences between groups were evaluated using one-way ANOVA followed by Bonferroni’s multiple comparison test. *P < 0.05, **P < 0.01, significantly different from the control.

