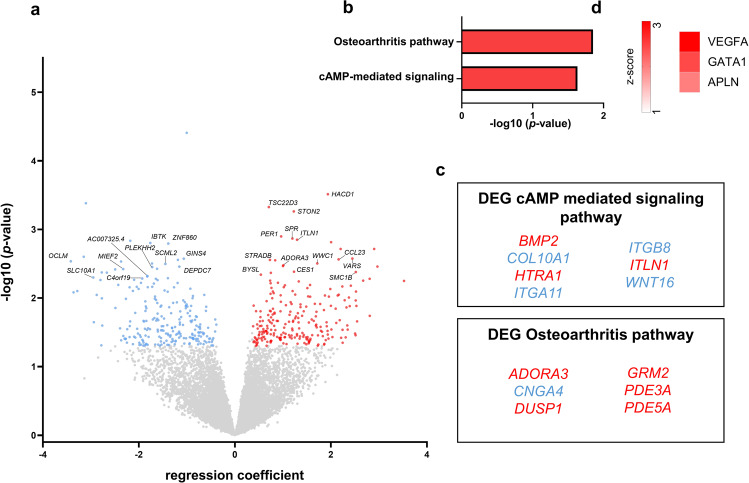
Fig. 3. Genes, biological pathways, and transcription factors associated with ketamine treatment response.
a Volcano plot showing the top 25 protein-coding genes associated with ketamine treatment response. Positive regression coefficient (red) indicates decreased gene expression with clinical improvements (i.e., higher delta MADRS), negative regression coefficient (blue) indicates that clinical improvement is associated with increased gene expression. b Ingenuity Pathway Analyzer (IPA) identified several pathways associated with ketamine treatment response (red = positive z-score)). c Genes enriched in the top two pathways (red = positive regression coefficient, blue = negative regression coefficient). d Predicted upstream regulators using Ingenuity Pathway Analysis (red = predicted activation).

