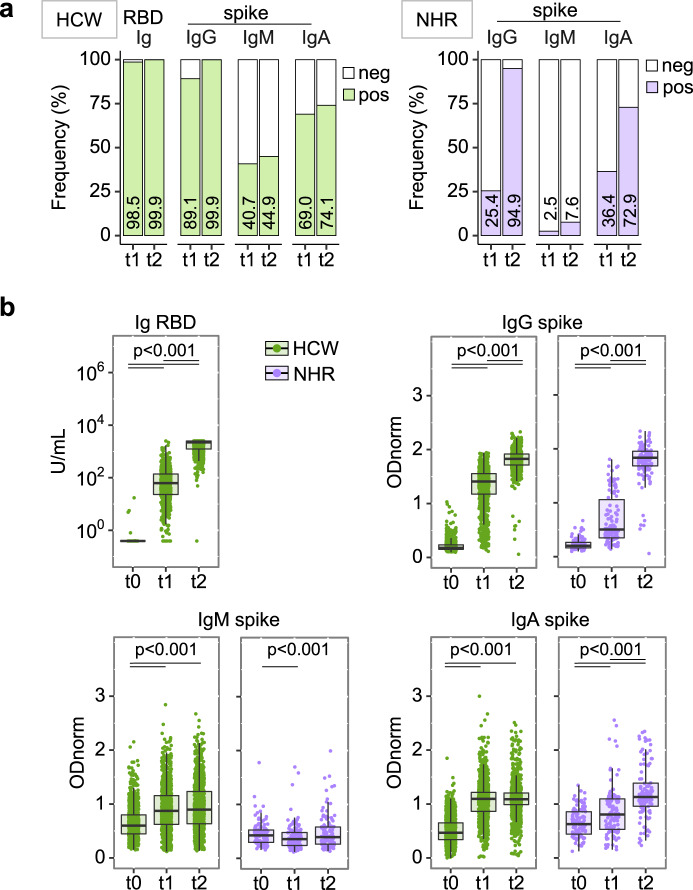
Fig. 2. Heterogenous anti-SARS-CoV-2-spike reactivities induced by vaccination.
Sera collected as in Fig. 1c were analysed for anti-RBD Ig (ECLIA) and anti-full-length spike protein IgG, IgM, and IgA (ELISA). Individuals positive for reactivities against SARS-CoV-2 N antigen were removed from the dataset. Health Care Workers (HCW) n = 948, in green, and Nursing Home Residents (NHR) n = 118, in purple. a Seroconversion defined by frequency of samples testing positive (colored bars) at the indicated day and assays. Respective values are indicated inside each bar. b Semi-quantitative measurements. Data points represent individual participants, boxes denote interquartile range, horizontal line represent the median, and whiskers denote the minimum and maximum values below or above the median at 1.5 times the interquartile range. Note the y scale differs for the anti-RBD ECLIA and the anti-spike ELISA data. Index ≥ 0.8 and ODnorm ≥ 1 define positivity in (a). Quade test for group difference across time points, p < 2.2 × 10⁻¹⁶ for all panels except NHR IgM where p = 0.001096. Pairwise Wilcoxon signed-rank test over time, two-sided, with p-value adjustment (Benjamini–Hochberg method). HCW: for anti-RBD Ig and anti-spike p < 2.2 × 10⁻¹⁶ (t0/t1, t0/t2, t1/t2); for anti-spike IgM p < 2.2 × 10⁻¹⁶ (t0/t1, t0/t2) and p = 0.4 (t1/t2); for anti-spike IgA p < 2.2 × 10⁻¹⁶ (t0/t1, t0/t2) and p = 0.39 (t1/t2). NHR: for anti-spike IgG p = 1.7 × 10−06 (t0/t1, t1/t2) and p = 6.4 × 10−05 (t0/t2); for anti-spike IgM p = 0.038 (t0/t1), p = 1.000 (t0/t2) and p = 0.318 (t1/t2); for anti-spike IgA p = 0.0014 (t0/t1, t0/t2) and p = 0.0039 (t1/t2). Significant p-values are indicated in each panel. Wilcoxon rank-sum test for difference between HCW and NHR at t1, p = 4.40 × 10⁻¹⁶ for IgG, p < 2.2 × 10⁻¹⁶ for IgM and p = 1.7056 × 10⁻¹³ for IgA; at t2 p = 0.9796 for IgG, p < 2.2 × 10⁻¹⁶ for IgM and p = 0.01084 for IgA. Source data are provided as a Source Data file.

