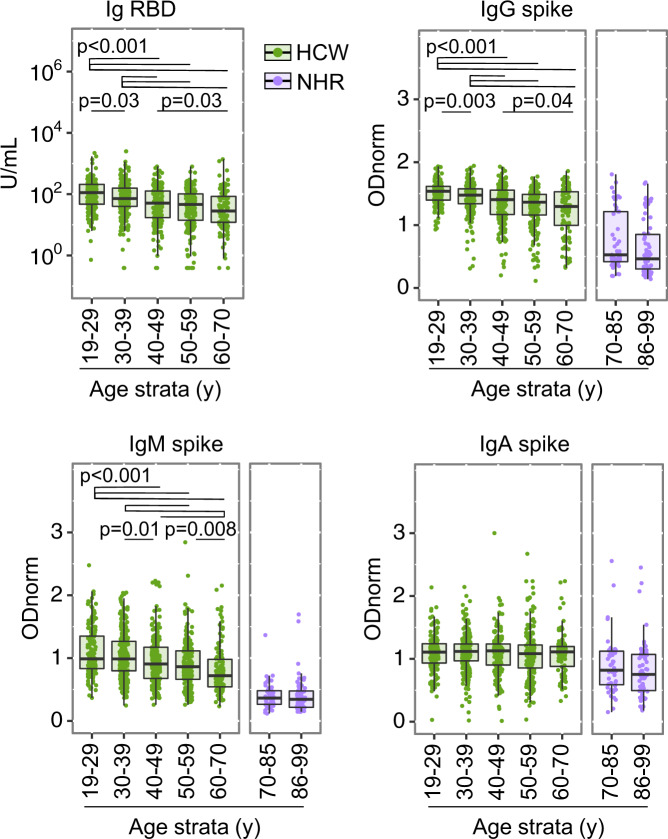
Fig. 3. Cumulative effect of age on anti-SARS-CoV-2-spike reactivities induced by vaccination.
Shown are semi-quantitative measurements in the Health Care Workers (HCW) n = 948, in green, and Nursing Home Residents (NHR) n = 118, in purple, cohorts at t1, as in Fig. 2B, now stratified by age group in 10 or 15 year intervals ([19–29]y n = 171; [30–39]y n = 251; [40–49]y n = 204; [50–59]y n = 216; [60–70]y n = 107; [70–85]y n = 51; [86–99]y n = 66). Data points represent individual participants, boxes denote interquartile range, horizontal lines represent the median, and whiskers denote the minimum and maximum values below or above the median at 1.5 times the interquartile range. Kruskal–Wallis test for group difference across HCW age groups, p = 1.875 × 10⁻¹⁵ for anti-RBD Ig, p < 2.2 × 10⁻¹⁶ for anti-spike IgG, p = 4.385 × 10⁻¹³ for anti-spike IgM, p = 0.55 for anti-spike IgA. Significant p-values from Pairwise Wilcoxon rank-sum comparison, two-sided, with p-value adjustment (Benjamini–Hochberg method), are indicated in each HCW panel. Wilcoxon rank-sum test comparing antibody levels in HCW age group [60–70]y and NHR age group [70–85]y at t1, p = 3.405 × 10−08 for IgG, p < 2.2 × 10⁻¹⁶ for IgM and p = 0.0002751 for IgA. in HCW p-values for comparisons [30–39] vs [19–29]; [40–49] vs [19–29] and vs [30–39]; [50–59] vs [19–29], vs [30–39] and vs [40–49]; [60–70] vs [19–29], vs [30–39], vs [40–49], and vs [50–59] are respectively: for anti-RBD Ig, p = 0.03345; p = 5.6 × 10−07 and p = 0.00065; p = 5.7 ×10⁻¹⁰, p = 5.1 × 10−07, and p = 0.16287; p = 1.6 × 10−09, p = 3.8 × 10-07, p = 0.02502, and p = 0.16287. For anti-spike IgG, p = 0.0031; p = 5.6 × 10−07 and p = 0.00065; p = 2.5 × 10⁻¹⁴, p = 9.3 × 10−09 and p = 0.0732; p = 2.4 × 10−09, p = 4.1 × 10−06, p = 0.0370 and p = 0.4323. For anti-spike IgM, p = 0.26467; p = 0.00068 and p = 0.00815; p = 6.8 × 10−07, p = 2.2 × 10−05, and p = 0.13583; p = 6.6 × 10⁻¹⁰, p = 1.4 × 10−08, p = 0.00033 and p = 0.00815. For anti-spike IgA, p = 0.79 for all comparisons. Source data are provided as a Source Data file.

