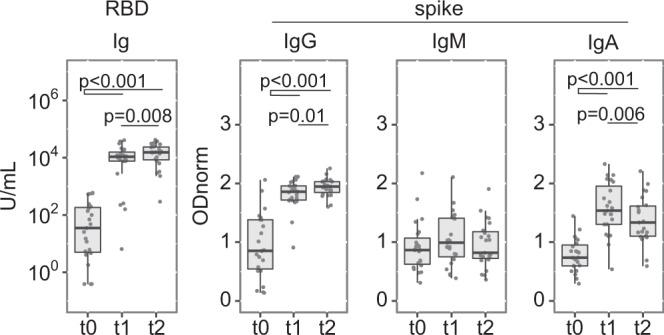
Fig. 5. Previous exposure to SARS-CoV-2 enhances vaccine-induced anti-SARS-CoV-2- spike reactivities.

Shown are semi-quantitative measurements at t0, t1, and t2 for n = 23 participants identified as anti-N positive at t0, prior to BNT162b2 vaccination. Data points represent individual participants, boxes denote interquartile range, horizontal lines represent the median, and whiskers denote the minimum and maximum values below or above the median at 1.5 times the interquartile range. For anti-RBD Ig quantification, samples with a value > or =2500 with the standard ECLIA assay were measured again after a 50x dilution. Quade test for group difference overtime points, p-values 5.383 × 10⁻¹⁰ for anti-RBD Ig, 8.013 × 10⁻¹⁰ for anti-spike IgG and 1.855 × 10−09 for anti-spike IgA, and p = 0.24 for anti-spike IgM. Wilcoxon signed-rank test for pairwise comparison, two-sided, with p-value adjustment (Benjamini–Hochberg method), significant p-values indicated in each panel. For anti-RBD Ig, p = 4.3 × 10−05 (t0/t1 and t0/t2) and p = 0.0081 (t1/t2); for anti-spike IgG, p = 5.7 × 10−05 (t0/t1 and t0/t2) and p = 0.014 (t1/t2); for anti-spike IgA p = 7.3 × 10−05 (t0/t1 and t0/t2) and p = 0.0059 (t1/t2). Source data are provided as a Source Data file.
