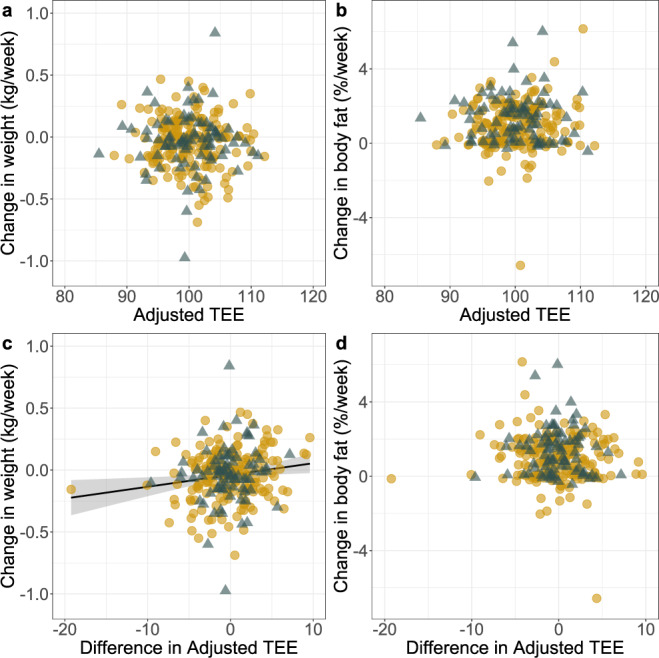
Fig. 2. Relationship between adjusted total energy expenditure (TEE), the difference in adjusted TEE between measurements and changes in body weight and body fat percentage.

Relationship between adjusted TEE (MJ/d; adjusted for FFM, FM, age, and sex) at the first measurement and a changes in body weight and b changes in body fat percentage until the second TEE measurement, and the relationship between the difference in adjusted TEE between measurements (i.e., adjusted TEE2 – adjusted TEE1), and c changes in body weight (linear regression line is shown and shaded area indicates 95% confidence interval) and d changes in body fat percentage until the second TEE measurement (N = 267 subjects aged 20–60 years; yellow circles present females and gray triangles present males).
