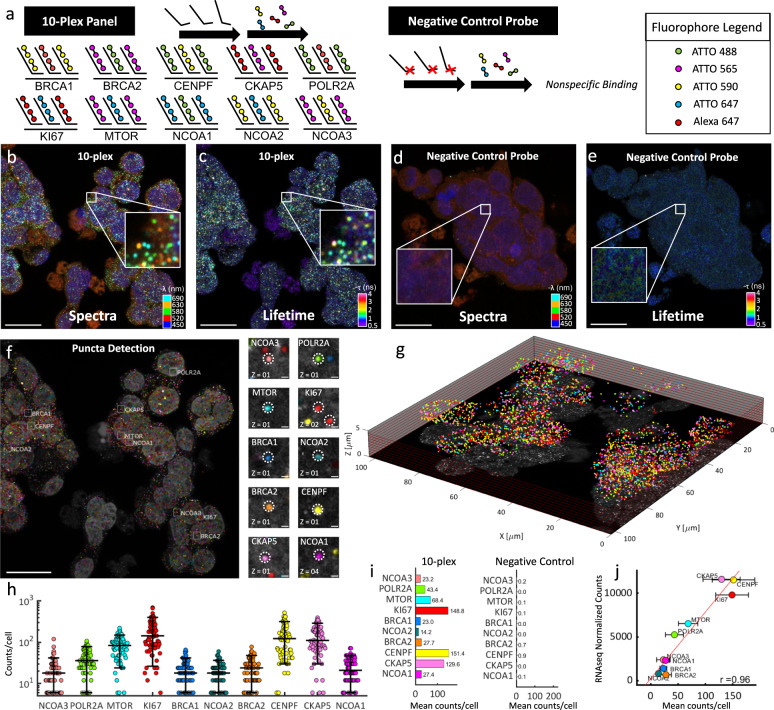
Fig. 4. Simultaneous 10-plex detection of transcripts for genes in colorectal cancer SW480 cells in a single round of labeling and imaging.
a 10 different gene transcripts are labeled with primary probes followed by respective and complementary fluorescent secondary probes. Each transcript is labeled with a combination of 2 out of 5 fluorophores for 10 combinations. Negative control probes (mNeonGreen, DCT, TYRP1, and PAX3) targeting transcripts not present in the sample were used with their respective secondary fluorophore probes. b Spectral image (max-projection in z) of a field of view of the labeled 10-plex sample (5-channel pseudo coloring). c Lifetime image (max-projection in z) of a field of view of the labeled 10-plex sample (phasor projection on universal circle pseudo coloring). d Spectral image of the labeled negative control probe sample. e Lifetime image of the labeled negative control probe sample. f Final puncta detection after being processed in our analysis software showing highlighted example puncta of each target (insets, right). g 3D representation of the field of view for the 10-plex sample. h Number of puncta detected for each gene target expression in each cell for the labeled 10-plex samples (overlaid lines correspond to quantiles [10,50,90]%, n=364 cells). i) Mean puncta counts per cell of transcripts for each gene in the 10-plex samples (left, n=3 experimental replicates, 364 total cells profiled) and negative control probe samples (right, n=3 experimental replicates, 189 total cells profiled). j Correlation of detected puncta (mRNA puncta count) vs. RNA-bulk sequencing (normalized counts) is shown for each target (mean + /− standard deviation, n=3 experimental replicates), yielding a correlation (Pearson r) of 0.96. Scale bar 20 µm in large images and 1 µm in insets. Source data are provided as a Source Data file.

