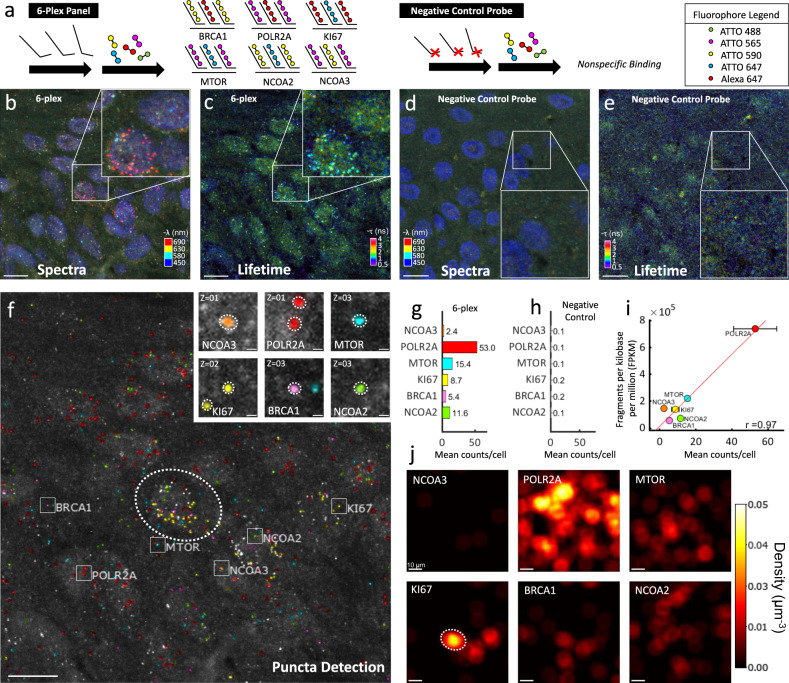
Fig. 5. Multiplexed mRNA detection in epidermis region of human skin melanoma FFPE tissue.
a 6 different types of gene transcripts were labeled with primary probes followed by respective and complementary fluorescent secondary probes. Each transcript was labeled with a combination of two different fluorophores for six combinations. Negative control probes targeting transcripts not present in the sample were used with their respective secondary fluorophore probes. b Spectral image (max-projection in z) of a field of view of the labeled 6-plex sample (three channel pseudo coloring). c Lifetime image (max-projection in z) of a field of view of the labeled 6-plex sample (phasor projection on universal circle pseudo coloring). d Spectral image of the labeled negative control probe sample is depicted. e Lifetime image of the labeled negative control probe sample. f Final puncta detection of the 6-plex field of view after being processed in our analysis software showing highlighted example puncta of each target (insets, right). g Mean puncta counts per cell of transcripts for each gene in the 6-plex sample (n=2 experimental replicates, 174 cells). h Puncta count for the negative control probe sample (n=2 experimental replicates, 375 cells). i Correlation of detected puncta (mRNA puncta count) vs. bulk sequencing (fragments per kilobase per million) is shown for each target. j Transcript density in the field of view for each of the expressed genes reveals clustering of specific genes, as an example KI67 appears highly expressed in three cells, one of them marked with a dotted ellipse that corresponds to location in f). Scale bars 10 µm in large images and 1 µm in insets. Source data are provided as a Source Data file.

