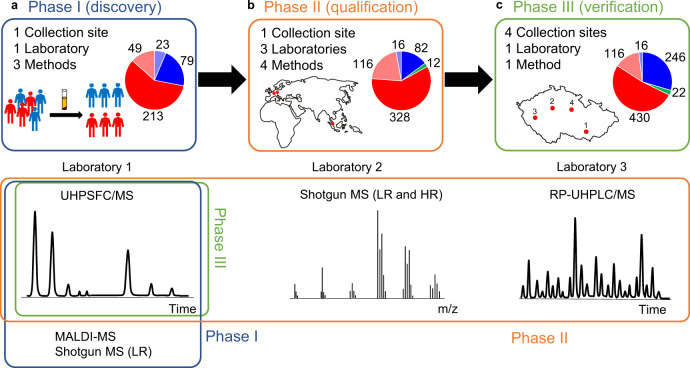
Fig. 1. Overview of study design for the differentiation of PDAC patients (T, red) from normal healthy controls (N, blue) and pancreatitis patients (Pan, green) based on the lipidomic profiling of human serum using various mass spectrometry-based approaches.
a Phase I (discovery) for 364 samples (262 T + 102 N) divided into training (213 T + 79 N) and validation (49 T + 23 N) sets measured by UHPSFC/MS, shotgun MS (LR), and MALDI-MS. b Phase II (qualification) for 554 samples (444 T + 98 N + 12 Pan) divided into training (328 T + 82 N + 12 Pan) and validation (116 T + 16 N) sets measured by UHPSFC/MS, shotgun MS (LR and HR), and RP-UHPLC/MS at 3 different laboratories. c Phase III (verification) for 830 samples (546 T + 262 N + 22 Pan) divided into training (430 T + 246 N + 22 Pan) and validation (116 T + 16 N) sets measured by UHPSFC/MS for samples obtained from four collection sites.

