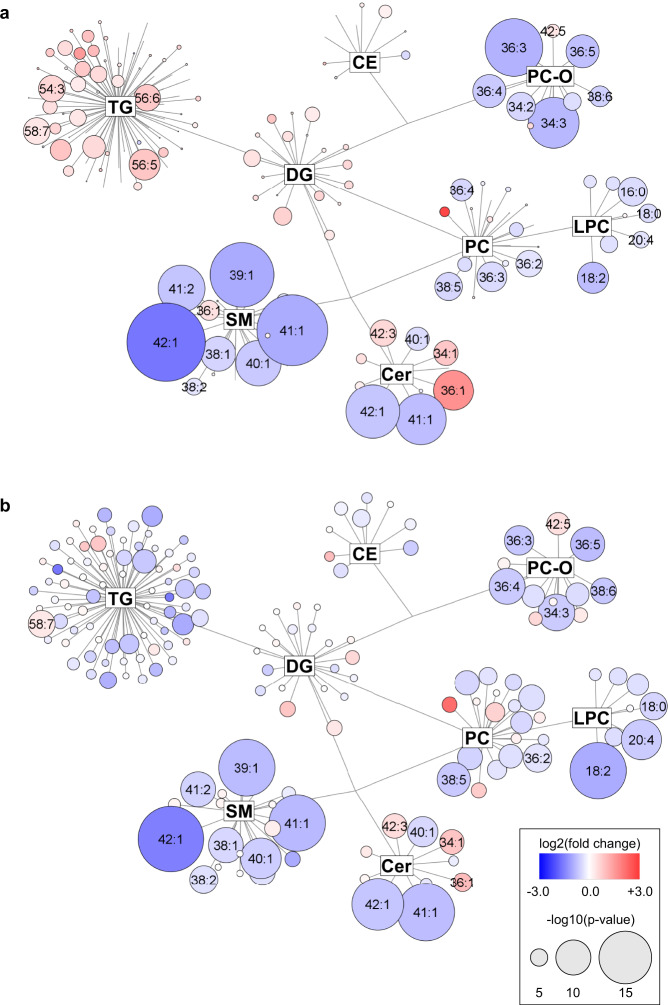
Fig. 10. Network visualization of the most dysregulated lipid species in PDAC for data from Phase III.
Graphs show lipidomic pathways with clustering into individual lipid classes for a males, and b females using the Cytoscape software (http://www.cytoscape.org). Circles represent the detected lipid species, where the circle size expresses the significance according to p-value, while the color darkness defines the degree of up/downregulation (red/blue) according to the fold change. The most discriminating lipids are annotated. Source data are provided as a Source Data file.

