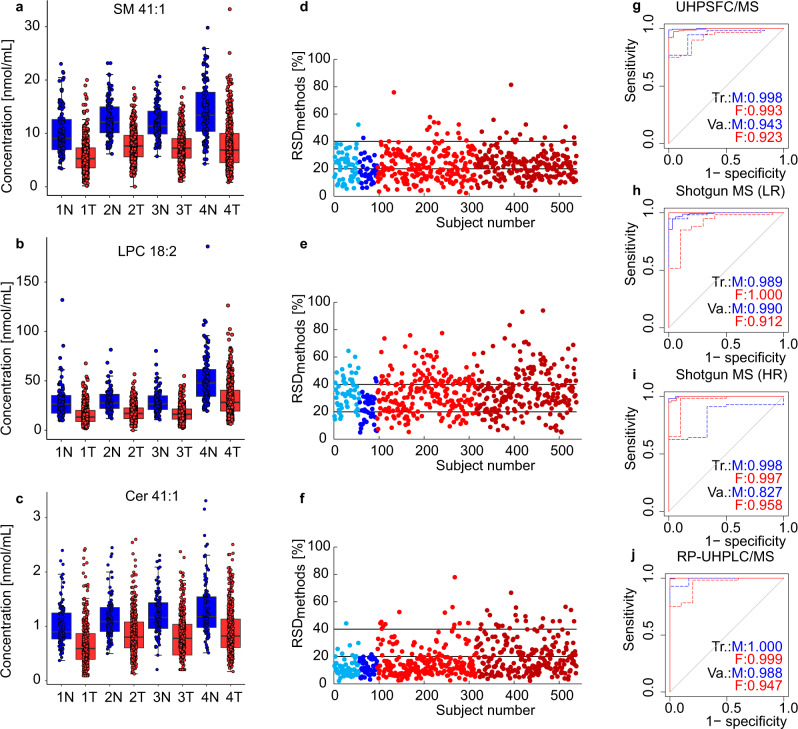
Fig. 4. Comparison of Phase II results obtained at three different laboratories using four mass spectrometry-based approaches.
Box plots of lipid concentrations normalized to the NIST reference material for samples obtained from PDAC patients (443 T) and healthy controls (95 N) of both genders including both validation and training sets: a SM 41:1, b LPC 18:2, and c Cer 41:1 for UHPSFC/MS (Method 1), shotgun MS (LR) (Method 2), shotgun MS (HR) (Method 3), and RP-UHPLC/MS (Method 4). In each box plot, the centerline represents the median, the bounds represent the 1st and 3rd quartile and whiskers span 1.5 fold inter-quartile range from the median. The RSD of the concentrations obtained by four methods for each sample d SM 41:1, e LPC 18:2, and f Cer 41:1. Color annotation: light blue—control females, blue—control males, red—cancer females, and dark red—cancer males. ROC curves for males (M) and females (F) in training (Tr.) and validation (Va.) sets: g UHPSFC/MS, h shotgun MS (LR), i shotgun MS (HR), and j RP-UHPLC/MS. Source data are provided as a Source Data file.

