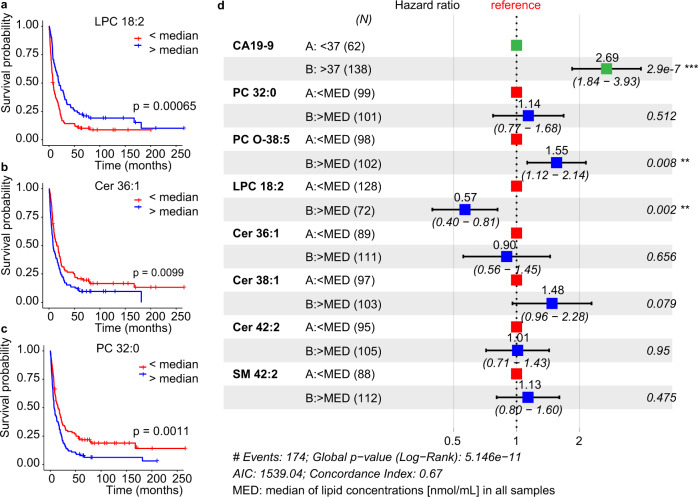
Fig. 9. Potential of selected lipids for the survival prognosis in Phase II measured by UHPSFC/MS.
Kaplan–Meier Survival plots for: a LPC 18:2 (n = 128 for binary code 0, and n = 72 for binary code 1), b Cer 36:1 (n = 89 for 0, and n = 111 for 1), and c PC 32:0 (n = 99 for 0, and n = 101 for 1) together with the two-sided log-rank test p-value. d Cox proportional-hazards model for CA 19-9, PC 32:0, PC O-38:5, LPC 18:2, Cer 36:1, Cer 38:1, Cer 42:2, and SM 42:2. The forest plot illustrates the 95% confidence intervals of the hazard ratios and the corresponding log rank test p values for every parameter are presented. Hazard ratios > 1 indicate poorer survival. Lipid species concentrations normalized to the NIST reference material obtained for all samples in Phase II were converted into the binary code, whereby 0 was set for c < median and 1 for c > median (the median of concentrations was calculated for each lipid species including all samples). Source data are provided as a Source Data file.

