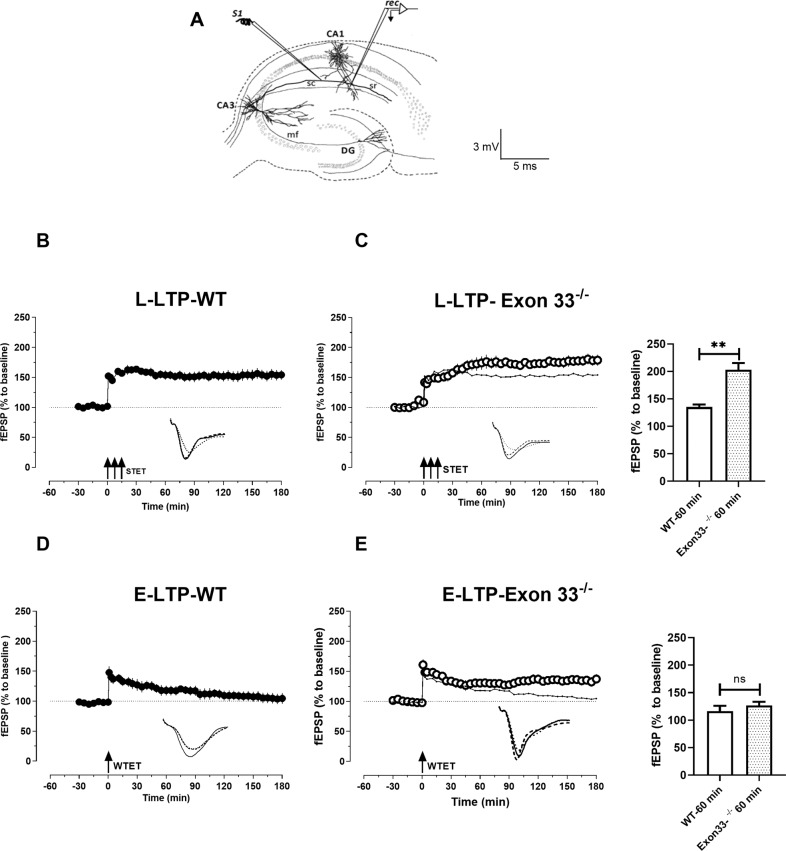
Fig. 1. Exon 33-/- mice displayed enhanced LTP and reinforced E-LTP to L-LTP.
A Schematic representation of a transverse hippocampal slice showing the positioning of electrodes in the CA1 region of hippocampus. One stimulating electrode S1 was placed in the stratum radiatum to stimulate Schaffer collateral fibres and a recording electrode ‘rec’ was placed in the CA1 apical dendritic region. B STET in synaptic input S1 resulted in a statistically significant potentiation that maintained for 180 min in WT mice (P = > 0.05, n = 9). C STET in Exon 33−/− mice also resulted in a long-lasting LTP with a higher percentage of potentiation than WT (Fig. 1B) from 30 min and remained stable for 180 min (U-test, 30 min, P = 0.002; 60 min, P = 0.002; 120 min, P = 0.002;180 min, P = 0.009, n = 9). Dotted line represents Fig B for comparison. D WTET in WT resulted only in a short-lasting LTP that decayed to the baseline (Wilcox, 15 min, P = 0.03, n = 7). E WTET in Exon 33−/− mice resulted in a long-lasting LTP that remained significant until 180 min (P = > 0.05, n = 7). Dotted graph represents D for comparison. The dotted line at 100% represents a line for reference. Error bars in all graphs indicate ±SEM. Analog traces represent typical fEPSPs of input S1 recorded 15 min before (dotted line), 30 min after (dashed line), and 180 min (solid line) after tetanisation. Bar graph represents the comparison of potentiation between WT and Exon 33−/− mice at 60 min post tetanisation. Three solid arrows represent the time of induction of L-LTP by STET for the induction of late-LTP. Single arrow represents the time point of induction of E-LTP by WTET. Scale bars: vertical, 2 mV; horizontal, 3 ms. STET-strong tetanisation, WTET-weak tetanisation.

