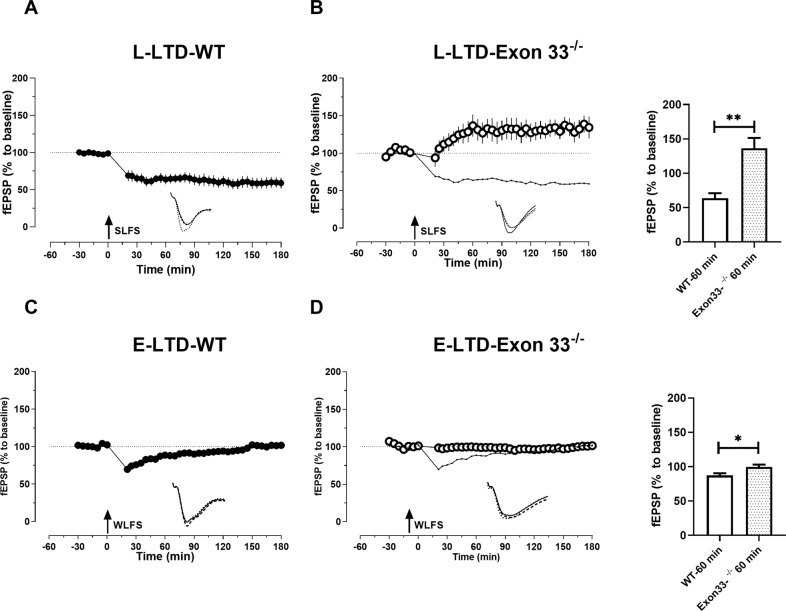
Fig. 2. Exon 33-/- mice displayed lack of LTD.
A Induction of LTD by using SLFS in WT mice, resulted in a stable depression that was statistically significant throughout the recorded time period of 180 min (P = > 0.05, n = 7). B SLFS was delivered to Exon 33−/− mice which resulted in a potentiation after 30 min and was stable for 180 min (n = 7). Dotted graph represents A for comparison. A significant difference was found between WT and Exon 33−/− mice from 25 min (Utest, 25 min, P = 0.004; 60 min, P = 0.001; 120 min, P = 0.001; 180 min, P = 0.001). C Induction of E-LTD using WLFS in WT mice showed a depression that was short lasting (85 min, P = 0.03, n = 8) which then returned to baseline levels. D Application of WLFS did not show any significant depression throughout the recording time period of 180 min in Exon 33-/- mice (P = < 0.05, n = 7). Dotted graph represents C for comparison. The bar graphs represents the comparison of potentiation/depression at 60 min time points between WT and to Exon 33−/− mice. Single arrow represents the time point of application of SLFS and WLFS. SLFS- strong low frequency stimulation, WLFS- weak low frequency stimulation. Analog traces and scale bars as in Fig. 1. Error bars in all graphs indicate ±SEM.

