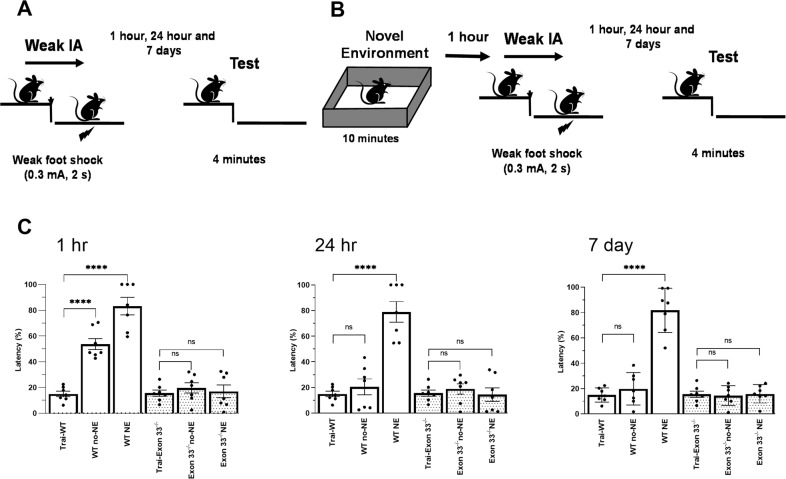
Fig. 3. Behavioural tagging is impaired in Exon 33-/- mice.
A Schematic diagram of experimental protocol used for control experiments in BT. Mice were given weak IA training by giving a weak foot shock consisting of 0.3 mA for 2 s. Step-down latency was tested at 1 h, 24 h, and 7 d post-IA training. The cut-off time for step-down latency was 4 min. B Schematic diagram of the experimental protocol used for BT paradigm. Mice were given weak IA training, 1 h after NE (10 min), by providing a weak foot shock. Step-down latency was tested at 1 h, 24 h, and 7 d post-IA. Associative memory was observed only in WT mice (blue bars) exposed to NE. Memory measured 1 h after IA training showed memory retention in WT mice, but not in Exon 33−/− mice (WT no-NE: P = < 0.0001; WT NE: P = < 0.0001; Exon 33−/− no-NE: P = 0.99; Exon 33−/− NE: P = > 0.9999 (n = 7 for all groups) (C 1 h). Memory measured at 24 h shows LTM only in WT mice with NE, but not in WT mice without NE and Exon 33−/− mice (WT no-NE: P = 0.97; WT NE: P = < 0.0001; Exon 33−/− no-NE: P = 0.99; Exon 33−/− NE: P = 0.99) (C 24 h). Similarly at 7 day, remote memory was seen only in WT mice with NE showing that Exon 33−/− mice was unable to acquire and retain memory (WT no-NE: P = > 0.9999; WT NE: P = < 0.0001; Exon 33−/− no-NE: P = > 0.9999; Exon 33−/− NE: P = > 0.9999) (C 7 day). Bar graphs representing WT is shown as open bars and Exon 33−/− mice as patterned bars (n = 7 from all groups). Error bars indicate ±SEM. Asterisks indicate significant differences between groups (ns = not significant, **p < 0.01, ***p < 0.001, ****p < 0.0001). Error bars indicate ±SEM. Asterisks indicate significant differences between groups. ns represents non-significant (ns) groups.

