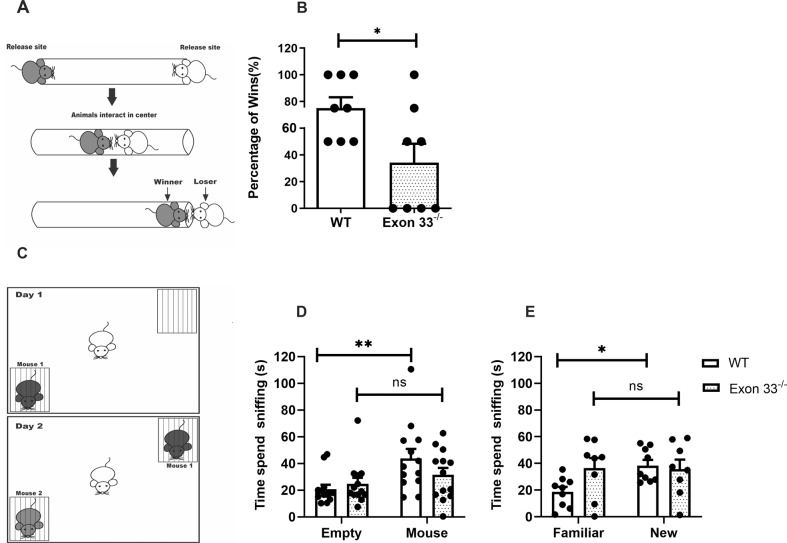
Fig. 4. Exon33-/- mice displayed deficits in social dominance, sociability and social preference.
A Schematic diagram of Tube Dominance Test. Two mice were placed on either side of a clear Plexiglass tube separated by removable separators. As they enter the tube from the release sites at opposite ends, they will interact at the middle of the tube. One of the mice must retreat for the other mice to continue. The dominant mice (grey) shows greater aggression and force the subordinate mice (white) to retreat. The test ends when one mouse pushed the other out of the tube. Winning was scored as binary win lose. B Exon 33−/− mice had significantly less wins than WT when tested against WT mice. Student t-test was used for statistical analysis (WT n = 8, Exon 33-/- n = 8, p = 0.026). C Schematic diagram of social interaction test. The subject mice (white) will be allowed to freely interact with two grid cups in the open field box. On day 1, one empty grid cup and one with Mouse 1 (dark grey) was placed in the box. On day 2, one grid cup will be with the familiar Mouse 1 (dark grey), which has been introduced on day 1 and the other grid cup with a new Mouse 2 (light grey). D on day 1, WT mice spent more time sniffing at the grid cup with mouse, while Exon 33−/− mice spent a similar amount of time at both grid cups. Two-way ANOVA with multiple comparisons was used for statistical analysis (WT n = 13, Exon 33-/- n = 13, F (1, 48) = 8.064, WT p = 0.0065). E On day 2, when a new Mouse 2 was introduced in the grid cup, WT mice spent more time sniffing at the grid cup with Mouse 2 (new) than Mouse 1 (familiar), while Exon 33 − /− mice still spent an equal amount of time at the two grid cups. Two-way ANOVA with multiple comparisons was used for statistical analysis (WT n = 9, Exon 33-/- n = 13, F (1, 30) = 2.757, WT p = 0.035).

