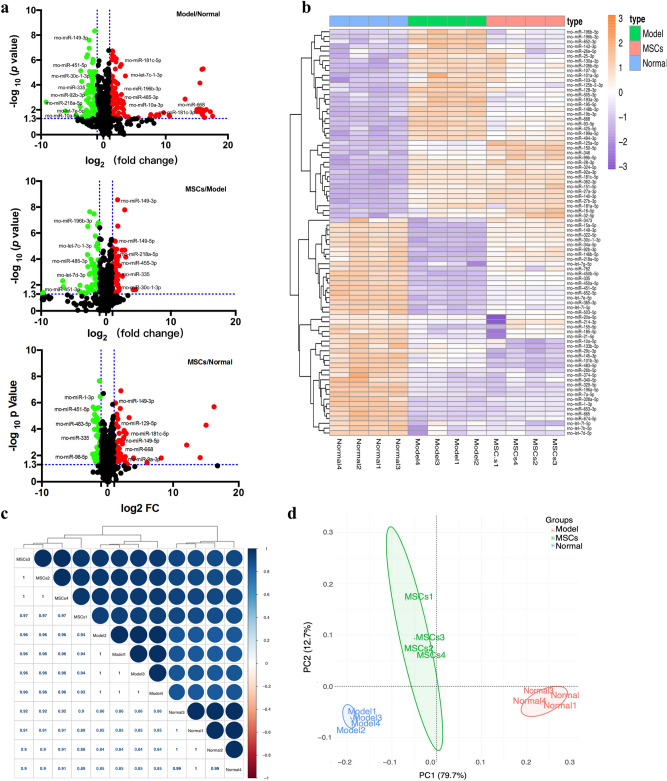
Figure 3.
Analysis of miRNA prolifing. (a) Volcano plot displaying the differentially expressed miRNA in Model/Normal, MSCs/Model, and MSCs/Normal groups by applying a twofold change expression difference with p < 0.05. (b) Heatmap display of normal, model and MSCs groups enriched differentially expressed miRNAs. (c) Hierarchical clustering analysis of miRNAs based on the correlation matrix among the normal, model and MSCs groups. (d) PCA of differentially expressed miRNAs profiling data to separate the whole samples into three groups.

