Figure 5.
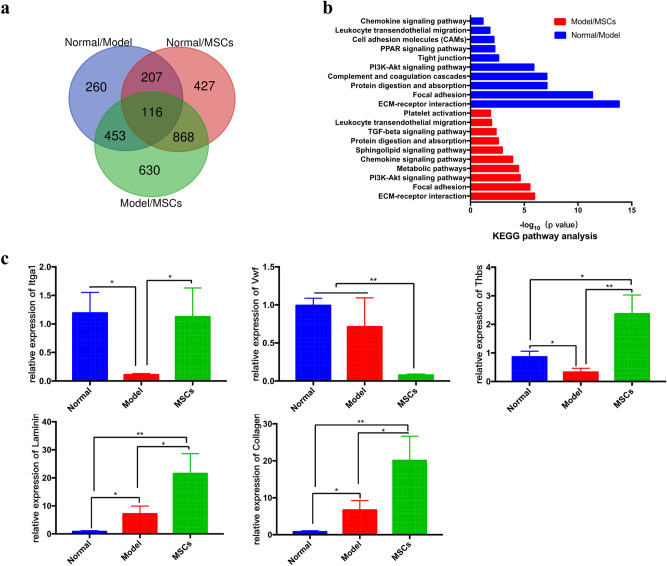
Relationship and functional analysis of differentially expressed mRNAs. (a) Venn diagram of genes differentially expressed in Normal/Model, Model/MSCs and Normal/MSCs groups. (b) KEGG pathway analysis36 of Normal/Model and Model/MSCs groups measured by mRNA microarray chip. (c) qRT-PCR verification of differentially expressed genes in ECM-receptor interaction signal pathway (These genes were obtained from MAP04512 and MAP04510 of KEGG: https://www.kegg.jp/kegg/). *p < 0.05, **p < 0.01.

