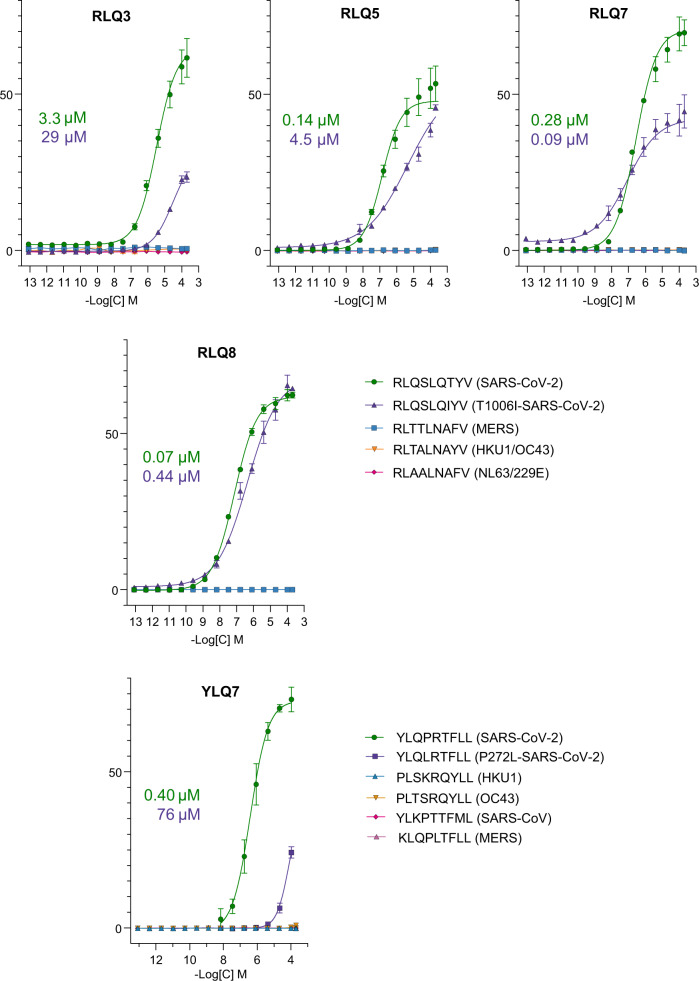
Fig. 2. T cell activation.
J76 TPR cell line with transgenic TCR were co-cultivated with K562-A*02 cell line loaded with various concentrations of the cognate peptide, mutant peptide, or the homologous peptides from the endemic coronaviruses (n = 3 independent replicates). T cell activation was measured by eGFP expression regulated by the NFAT promoter. Plotted are the mean share of eGFP+ cells and SD. Studied receptor is indicated above each graph. IC50 values are shown for the cognate peptide (green) and mutant peptide (violet).

