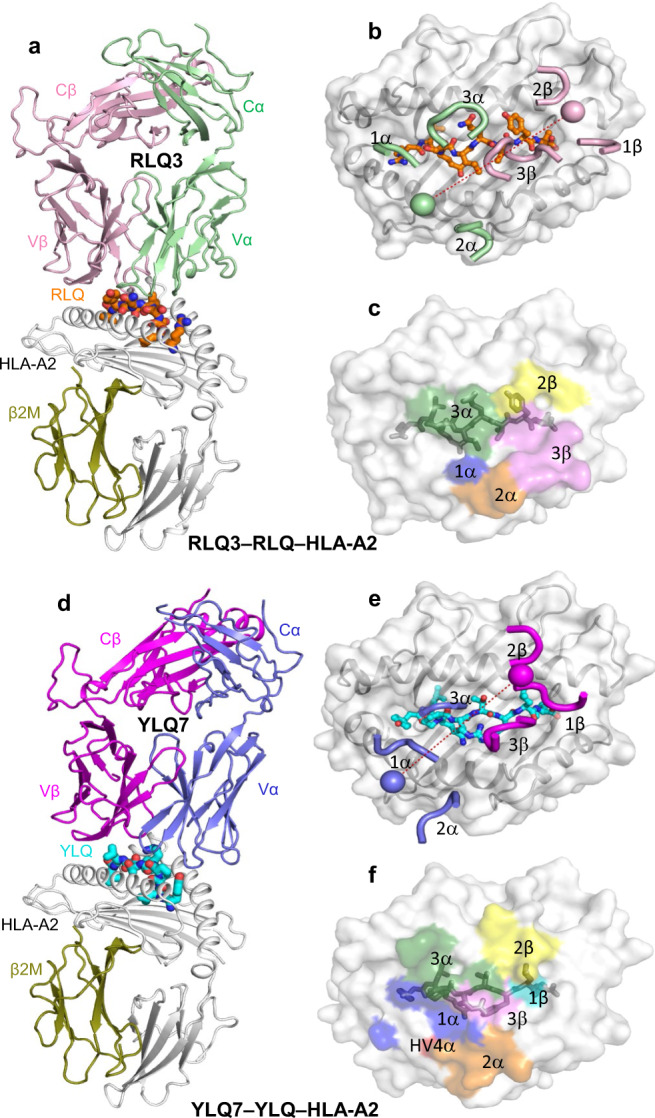
Fig. 4. Structure of RLQ3–RLQ–HLA-A2 and YLQ7–YLQ–HLA-A2 complexes.

a Side view of RLQ3–RLQ–HLA-A2 complex (ribbon diagram). TCR α chain, green; TCR β chain, pink; HLA-A2 heavy chain, gray; β2-microglobulin (β2m), olive. The RLQ peptide is orange. b Positions of CDR loops of TCR RLQ3 on RLQ–HLA-A2 (top view). CDRs of RLQ3 are shown as numbered green (CDR1α, CDR2α, and CDR3α) or pink (CDR1β, CDR2β, and CDR3β) loops. HLA-A2 is depicted as a gray surface. The RLQ peptide is drawn in orange in stick representation. The green and pink spheres mark the positions of the conserved intrachain disulfide of the Vα and Vβ domains, respectively. The red dashed line indicates the crossing angle of TCR to pMHC. c Footprint of TCR RLQ3 on RLQ–HLA-A2. The top of the MHC molecule is depicted as a gray surface. The areas contacted by individual CDR loops are color-coded: CDR1α, blue; CDR2α, orange; CDR3α, green; HV4α, red; CDR1β, cyan; CDR2β, yellow; CDR3β, pink. d Side view of YLQ7–YLQ–HLA-A2 complex. TCR α chain, blue; TCR β chain, magenta. The YLQ peptide is cyan. e Positions of CDR loops of TCR YLQ7 on YLQ–HLA-A2 (top view). f Footprint of TCR YLQ7 on YLQ–HLA-A2.
