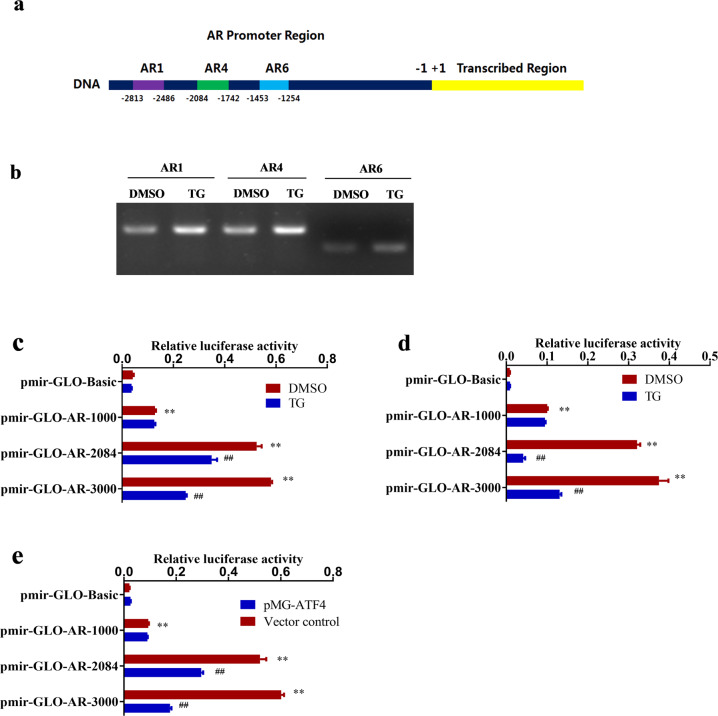
Fig. 6. ATF4 bound to AR promoter region and inhibited AR promoter activity.
a Schematic representation of the AR promoter and ATF4 binding sites. b MDA-MB-453 cells were treated with 1 μM TG for 24 h. Then ChIP-PCR was performed using anti-ATF4 antibodies. c, d MDA-MB-453 (c) and LNCap cells (d) were transfected with AR luciferase reporter plasmids or control plasmid pmir-Glo-Basic and then treated with 1 μM TG. Luciferase activities were measured using a dual-luciferase reporter assay system according to the manufacturer’s protocol. The relative luciferase activity was calculated and expressed as mean ± SD. Student’s t-test, **p < 0.01 vs. pmir-GLO-Basic (DMSO); ##p < 0.01 vs. corresponding pmir-GLO-AR (n = 3). e The AR luciferase reporter plasmids and ATF4-overexpressing plasmids or empty vector control were contransfected into MDA-MB-453 cells. Luciferase activities were measured. The relative luciferase activity was calculated and expressed as mean ± SD. Student’s t-test, **p < 0.01 vs. pmir-GLO-Basic (DMSO); ##p < 0.01 vs. corresponding pmir-GLO-AR (n = 3).

