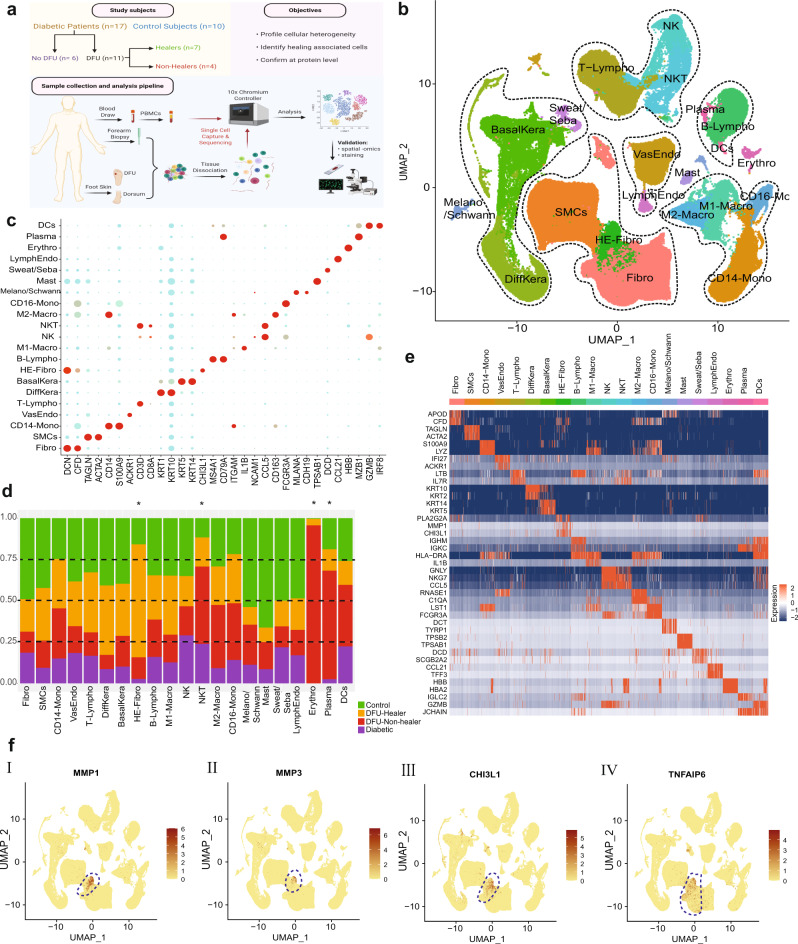
Fig. 1. Single-cell RNA sequencing mediated identification and characterization of unique healing enriched fibroblasts in diabetic foot ulcers (DFUs).
a Schematic overview of the study design and number of samples per clinical group. b Uniform Manifold Approximation and Projection (UMAP) embedding of the entire dataset consisting of 174,962 cells. The cells are colored by orthogonally generated clusters, and labeled by manual cell type annotation (HE-Fibro: healing enriched fibroblasts, Fibro: fibroblasts, SMCs: smooth muscle cells, BasalKera: basal keratinocytes, DiffKera: differentiated keratinocytes, Sweat/Seba: sweat and sebaceous gland cells; Melano/Schwann: melanocytes and Schwann cells; Mast: mast cells; VasEndo: vascular endothelial cells; LymphEndo: lymphatic endothelial cells; CD14-Mono: CD14+ monocytes, CD16-Mono: CD16+ monocytes, M1-Macro: M1 macrophages, M2-Macro: M2 macrophages, Erythro: erythrocytes, NK: natural killer cells, T-Lympho: T-lymphocytes, NKT: NK cells and T lymphocytes; B-Lympho: B-lymphocytes, Plasma: plasma cells, DCs: dendritic cells). Dotted lines are drawn around cell groups of similar lineages. c Dot plot showing expression of different cell type-specific marker genes, used to annotate the cell types. Size of dots indicates percentage of cells in each cell cluster expressing the marker gene; color represents averaged scaled expression levels; cyan: low, red: high. d Stacked bar plots showing the proportion of different cell types across the four clinical groups. Green: Healthy subjects, orange: DFU-Healers, red: DFU-Non-healers, purple: Diabetic patients. Cell types with significant differences among the clinical groups are marked with an asterisk. The bar plots for individual cell types are presented in Supplementary Fig. 1. e Heatmap showing the top highly expressed (red) genes in each of the cell clusters. f Feature plots depicting the expression of key genes (I) MMP1, (II) MMP3, (III) CHI3L1, (IV) TNFAIP6, that were significantly overexpressed in the healing enriched fibroblasts associated with healing of DFUs. The schematic on (a) was created with BioRender (BioRender.com).

