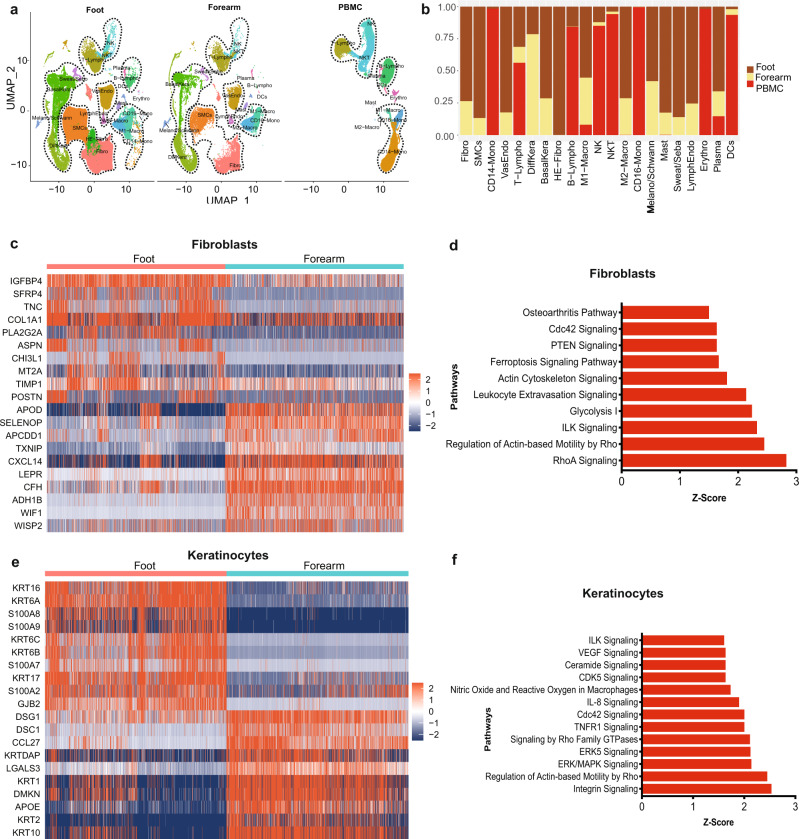
Fig. 2. Comparative single-cell transcriptome analysis profiles of foot, forearm, and PBMCs, delineating gene signatures, and biological pathways across anatomical sites.
a Split UMAP of Foot, Forearm, and PBMC samples. The cell clusters were annotated manually according to various canonical and novel cell types based on expression of specific markers (as described in Fig. 1b, c). Dotted lines are drawn around cell groups of similar lineages. b Stacked bar plots showing the proportion (y-axis) of different cell type from foot, forearm, and PBMC. Dark brown: foot, beige: forearm, red: PBMCs. c Heatmap showing significantly differentially expressed genes between foot and forearm fibroblast cell clusters. Relative gene expression is shown in pseudo color, where blue represents downregulation, and red represents upregulation. d Pathway enrichment analysis on genes that are significantly differentially expressed between foot and forearm cell fibroblast clusters. The pathways analysis was performed using Ingenuity Pathways analysis (IPA) tool that calculate significance of impact on pathways using one-tailed Fisher’s exact test and Z-score. The pathways with P value < 0.01 and Z score >2 were considered significantly activated. e Heatmap showing significantly differentially expressed genes in keratinocytes cell clusters between foot and forearm samples. f Pathway enrichment analysis on genes that are significantly differentially expressed between foot and forearm keratinocytes cell clusters.

