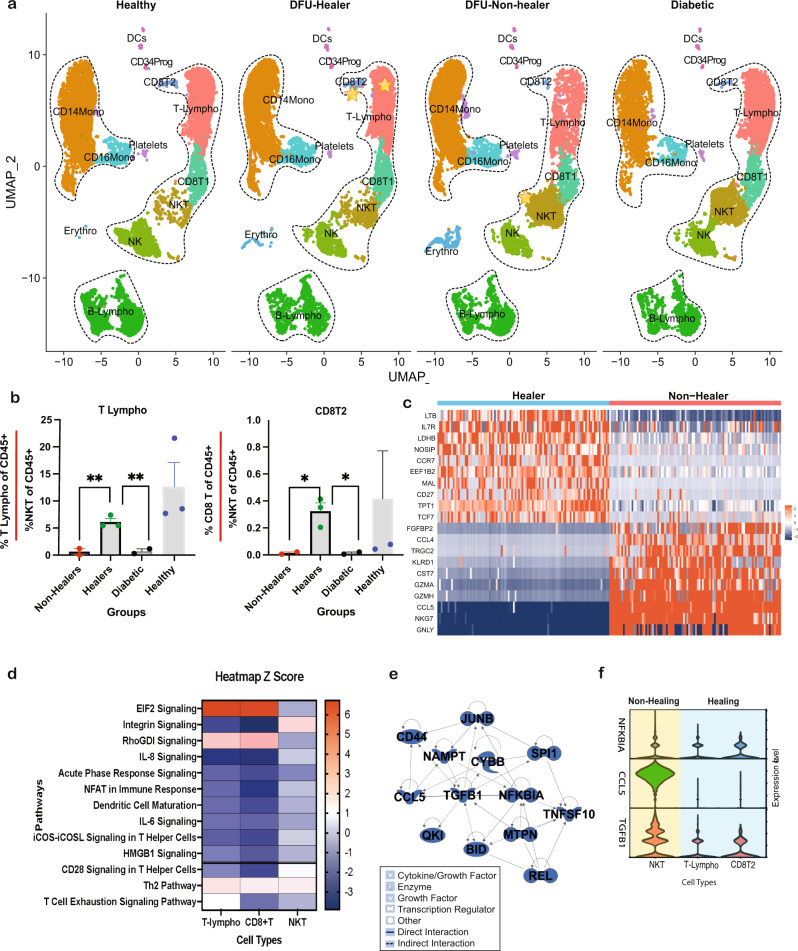
Fig. 3. Comparative transcriptome profiles analysis of PBMCs in different clinical groups, uncovering differences in systemic immune landscape associated with wound healing response in DFUs.
a UMAP dimensionality reduction embedding of PBMCs from DFU-Healers, DFU-Non-healers, Healthy subjects, and non-DFU DM patients. The identified cell types were DCs: dendritic cells; VasEndo: vascular endothelial cells; T-lympho: T lymphocytes; CD8T1: CD8+ T lymphocytes cluster 1; CD8T2: CD8+ T lymphocytes cluster 2; NK: natural killer cells; NKT: natural killer and T cells; B-lympho: B lymphocytes; CD14Mono: CD14+ monocytes; CD16Mono: CD16+ monocytes. Dotted lines are drawn around cell groups of similar lineages. b Bar plots showing percentage of T-lymphocytes (T-lympho) and CD8+ T lymphocytes cluster 2 (CD8T2) per percentage of NKT cells in the CD45+ subset of cells across various clinical groups. DFU-healers depict significantly higher ratio of T-lympho and CDT2 cell cluster in comparison to DFU-Non-healers and Diabetic. Data represent the mean and standard error of mean (SEM) values from n = 2 Non-Healers, n = 3 Healers, n = 2 Diabetic and n = 3 Healthy subjects. p = 0.01 for Healers vs Non-Healers and p = 0.006 for Healers vs Diabetic in T-Lympho; p = 0.036 for Healers vs Non-Healers and p = 0.035 for Healers vs Diabetic in CD8T2 using two-sided Welch’s t-test. c Heatmap showing significant DEGs in Healers compared to Non-healers in the T-lympho, CD8T2 and NKT cell clusters. d Biological pathways that are significantly (P value < 0.01) activated (Z score >1.5) /inhibited (Z score < −1.5) in T-lympho, CD8T2 cells of Healers in contrast to NKT cells of Non-healers. Activation and inhibition of key upstream regulators is shown in pseudo color, where blue represents inhibition, and red represents activation. e Upstream regulatory molecules significantly inhibited (blue) in the T-lympho and CD8T2 cells of Healers as compared to Non-healers at the systemic level. Legend shows shapes and lines annotation for the regulatory network. f Violin plots showing expression levels of 3 key upstream regulator molecules NFKBIA, CCL5, and TGFB1, in the NKT, T-Lympho, and CD8T2 clusters.

