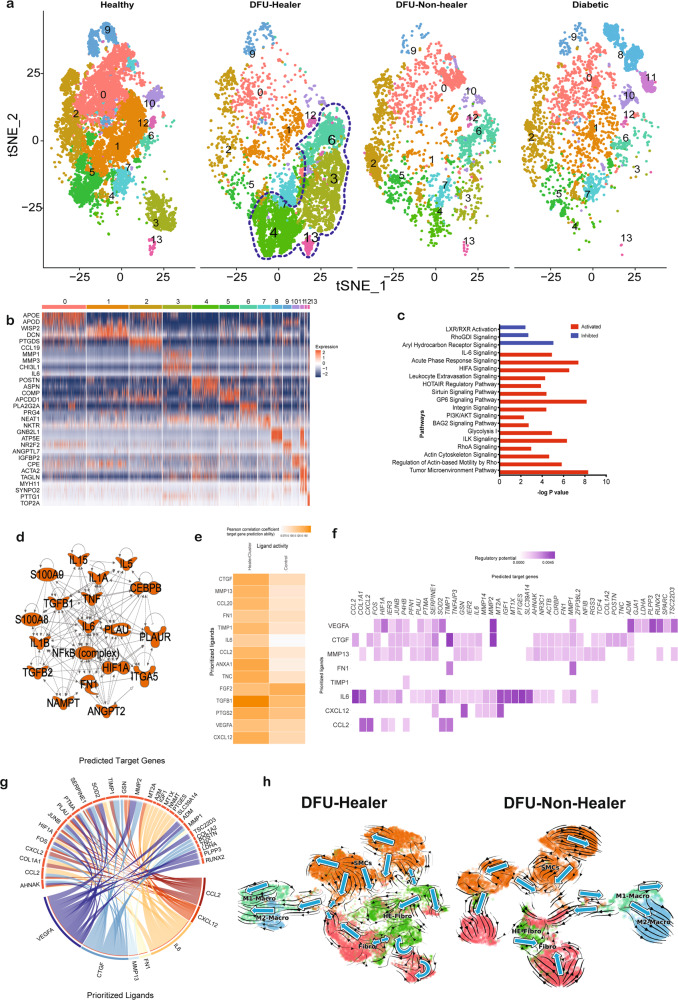
Fig. 5. Identification and characterization of distinct subpopulations of fibroblasts with specific gene signature associated with healing DFUs.
a t-distributed Stochastic Neighbor Embedding (t-SNE) analysis depicting 14 sub-clusters of fibroblasts. The sub-clusters enriched in DFU-Healers are marked with lasso. b Heatmap showing the top highly expressed genes (red) in sub-clusters. c Selected biological pathways that are significantly (P value <0.01) affected in the healing enriched fibroblasts. The directionality of each pathway is depicted using a pseudo color (red for activated, blue for inhibited). d Regulators that are significantly activated in the healing enriched fibroblasts. e Heatmap showing the Pearson correlation between ligands from ‘sender’ sub-cluster 3 and target gene expression in ‘healer fibroblasts, i.e., the other HE-Fibro sub-clusters 4, 6, and 13 (left column), and ‘control’ fibroblasts sub-clusters 0, 2, and 5 (right column). A darker orange color indicates a higher Pearson correlation between the ligand and gene expression within the receiver cell population. f This heatmap of select ligands expressed by HE-Fibro sub-cluster 3 (rows) to regulate the genes which are differentially expressed by the ‘healer’ fibroblasts (columns). Well-established ligand-target gene interactions shown with a darker shade of purple. g Circos plot displaying the association between ligands expressed in the sub-cluster 3 (bottom semi-circle) with their targeted differentially expressed genes in sub-clusters 4, 6, and 13. h RNA Velocity plots for DFU-Healer and DFU-Non-healer subsets; black streamline arrows represent predicted direction of cell state change and trajectories. Larger blue arrows represent overall velocity for each area of the UMAP.

