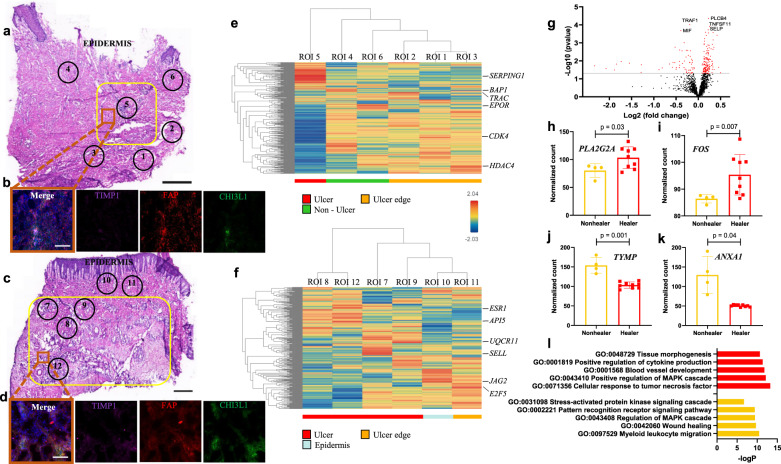
Fig. 6. Exploring the spatial transcriptome of DFU-Healers and DFU-Non-healers.
a, c Representative H&E-stained sections from a (a) non-healing and (c) healing DFU. Yellow box demarcates the ulcer area and numbered circles the ROIs selected for sequencing. b, d Immunofluorescence staining for HE-Fibro markers TIMP1 (purple), CHI3L1 (green), and pan-fibroblast marker FAP (red) performed on a serial section from the same sample. DAPI was used for nuclear counterstain. The location of the image capture is noted with an orange box on (a) and (c). e, f Hierarchical clustering analysis heatmaps depict the transcriptomic profiles of the selected ROIs. The most highly expressed gene per ROI is highlighted. ROIs were annotated based on their location as Ulcer (red), Non-Ulcer (green), Ulcer edge (orange), and Epidermis (light blue). Expression levels are shown according to the gradient middle right (blue low to red high). g Volcano plot showing DE analysis results from ROIs within the ulcer in Healers (2 patients, 9 ROIs) vs Non-healers (2 patients, 4 ROIs). Each dot represents a gene, with red ones being above the significance threshold. The top five genes are highlighted. h–k Selected notable genes upregulated in Healers (h, i) and Non-healers (j, k). Data represent mean ± SD from n = 4 ulcer ROIs of 2 Non-healers and n = 9 ulcer ROIs of 2 Healers. Two-tailed unpaired t-test with Benjamini–Hochberg procedure for adjusted p-values was used to calculate p-values. l GO analysis for biological processes enriched in Healers (top, red) and Non-healers (bottom, yellow). Stainings were performed three times with two biologically independent patient samples per group. Scale bars are 1 mm in (a, c) and 100 μm in (b, d).

