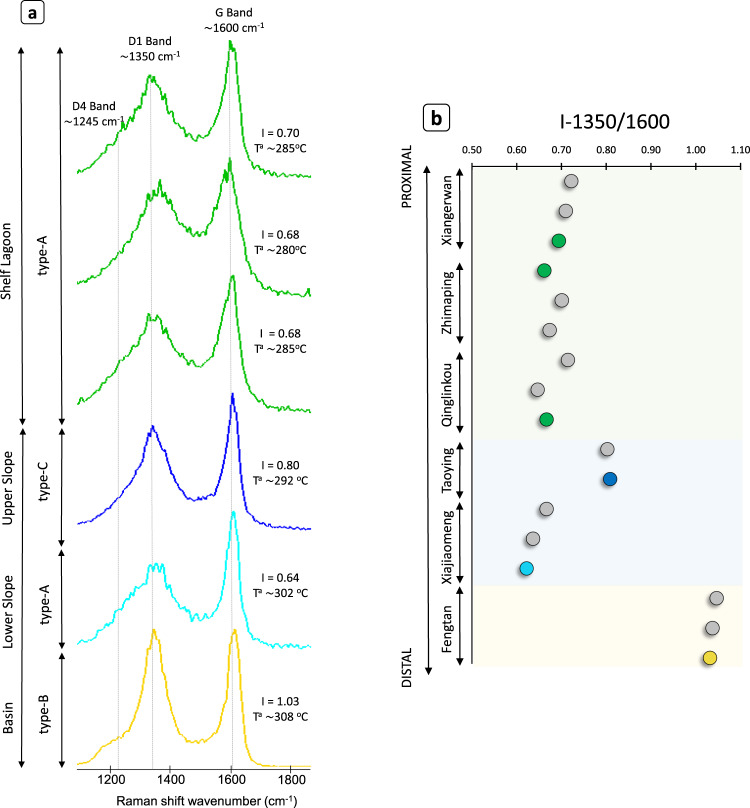
Fig. 3. Raman spectra of organic matter in Doushantuo Member IV.
a Raman spectra are organized by depositional environments and show the disordered but variable structure of the different kerogen types proposed (A, B and C). The two broad bands at ∼1350 cm−1 and ∼1600 cm−1 are used to calculate peak metamorphic temperatures and yield an intensity ratio defined as I-1350/1600 (I in this figure). D4 band is a secondary band that shows a well-developed shoulder in the basin sample. b Compilation of I-1350/1600 results from seventeen samples of the studied sections showing the distribution of the calculated intensity ratio along the basin. The colored circles represent samples shown in a.

