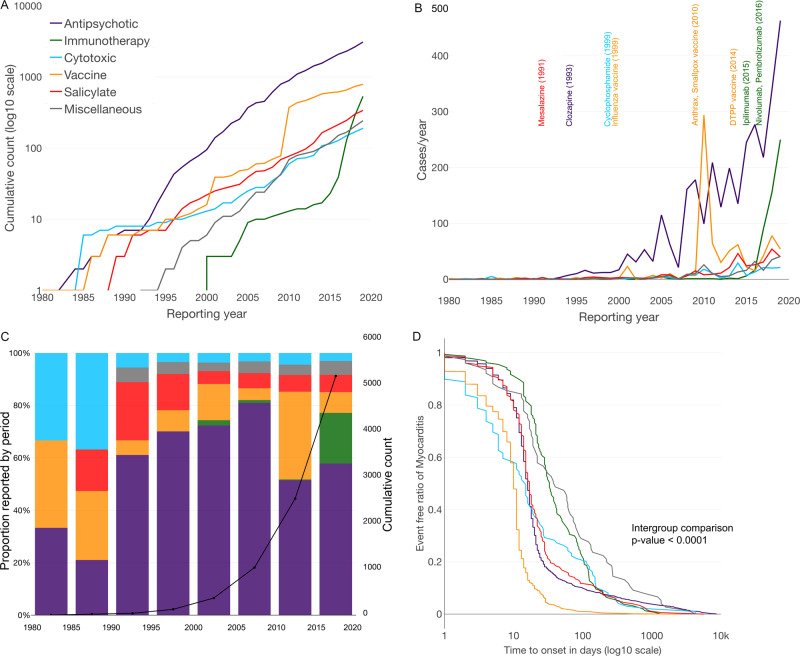
Fig. 3. Evolution of reporting across time, by drug classes.
Evolution of cumulative number of reports per year (A); of cases per year, by drug class (B); of proportion of each drug class by half-decade (C); and time to onset between first treatment intake and myocarditis event (D). In B, are also mentioned all drugs with more than 80 reports over time, and corresponding year when the information component (IC) became significant with an IC025 > 0. In D, intergroup comparison represents the comparison between all groups, regarding the time to onset between first treatment intake and myocarditis event (using Kruskal–Wallis methods). DTPP diphteria, tetanus, pertussis and/or poliomyelitis vaccine.

